![]()
10 Weeks to Vegan is an email series and companion Facebook support group that provides participants with motivation, recipes, and resources to help them eat animal-free. We’ve adapted dozens of versions for different countries and regions.
Most participants take a survey when they sign up, and then they’re also sent a survey two weeks after the series ends. We’ve also surveyed a segment of participants after 6 months.
Our surveys in most countries have resulted in high rates of participants becoming vegetarian or vegan, usually 10 to 30%. We’ve conducted one survey where we had a randomized control group and we’re planning to do that again relatively soon.
2025 Survey Results
In previous surveys, discussed in sections below, we limited our participants to specific countries. More recently, we finished adding the infrastructure to be able to survey participants from all countries where we have a 10 Weeks to Vegan program.
By April of 2025, we had enough results from a wide array of countries as well as from participants in our completely revamped United States 10 Weeks to Vegan series. The new version, which we refer to internally as 10 Weeks 2.0, launched at the end of October 2024. We’ve since completed 10 Weeks 2.0 for a few other countries, but they’re not in the results below from April 2025.
We’re happy to report that the conversion rates for 10 Weeks 2.0 are higher than for the original version (see our previous United States surveys below). The United States 10 Weeks 2.0 had a conversion rate to vegetarian or vegan of 34% based on diet frequency questions, while all the countries combined had a conversion rate of 16%, and English-speaking countries had a conversion rate of 22%.
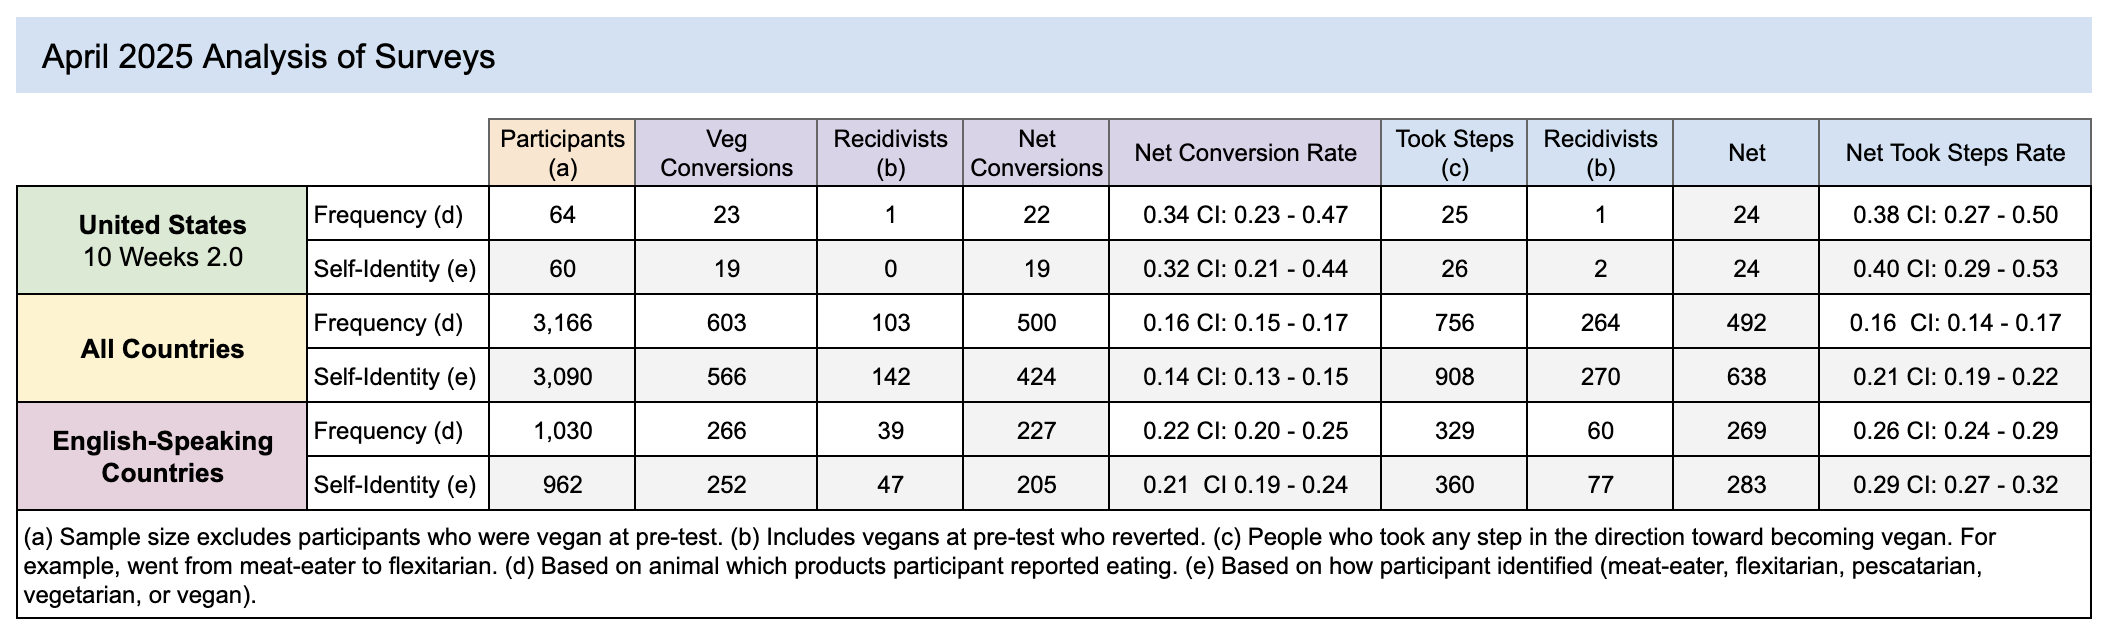
We attribute some of the recidivism to people not being clear on the definitions of terms like vegan or flexitarian when taking the pre-test.
2023 Randomized Controlled Survey
In 2022-23, Vegan Outreach conducted a survey to assess the effectiveness of 10 Weeks to Vegan by including a randomized control group. Previously, we conducted numerous surveys to determine whether participants had converted to vegetarian or vegan, but this time we wanted to include a control group to see if people who sign up for 10 Weeks to Vegan were likely to change even if they don’t receive the series.
Methodology
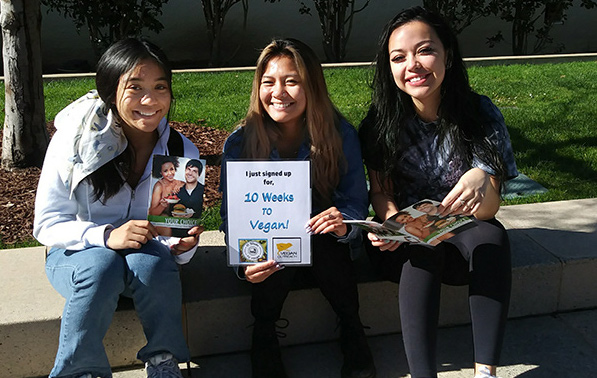
The surveys ran in Chile, Vietnam, and the United States. Instagram and Facebook users in our target audience were shown our typical ads used to pique interest in learning more about going vegan (the image at the top of this page is representative of ads we typically run). When someone clicked on the ad, they were taken to a screen explaining that we were conducting research and asking if they would take part. We let them know that if they agreed to participate, they might not receive any information about becoming vegan for 12 weeks. If they declined to participate, we sent them to our usual signup form for 10 Weeks to Vegan and they were not part of the study.
To encourage participation, we told them that they would be added to a raffle in which two randomly chosen participants per month, from each country, would win a $50 Amazon gift card (U.S. and Chile) or a 500,000 VND Tiki voucher (Vietnam).
If they agreed to participate, they were presented with a pre-test survey. After they took the survey, they were randomly assigned to be in either the treatment group (receiving the usual emails from the 10 Weeks to Vegan program) or the control group (receiving no emails). People in the treatment group were also invited to be part of the 10 Weeks to Vegan Facebook support group for their country. After 12 weeks, both the treatment and control groups were sent a post-test survey to fill out.
Conversion Rates
The main outcome we measured was the net conversion rate of the treatment and control groups. We defined a conversion as someone who reported going from meat-eater to vegetarian, from meat-eater to vegan, or from vegetarian to vegan. A recidivist was someone who changed in the opposite direction. The net conversion rate was the number of conversions minus the number of recidivists divided by the total number of participants.
We measured whether someone was a meat-eater, vegetarian, or vegan in two different ways:
- Based on diet frequency (how often they eat various categories of animal products)
- Based on how they self-identify: meat-eater, flexitarian, pescatarian, lacto-ovo vegetarian, or vegan
We asked the diet frequency questions before asking how they identify so as not to predispose them to answer the diet frequency questions according to how they identify. We considered flexitarians and pescatarians to be meat-eaters.
Unfortunately, we made an error on the Vietnam self-identify questions rendering those responses unusable, but we were able to include the data for the diet frequency questions.
Results
The survey began in April of 2022 and lasted until June of 2023.
Our response rates were relatively low, as seen in the chart below.
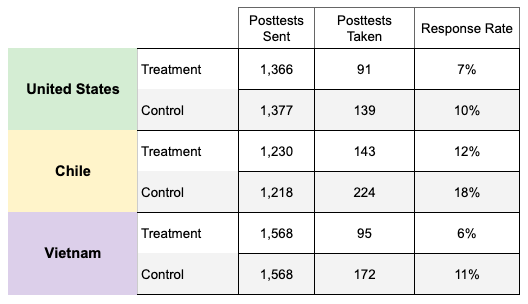
We suspect that the response rate for the control group was higher than that for the treatment group because the treatment group’s post-test was longer than the control group’s. We also suspect that Chile had a higher response rate because their potential reward was relatively higher than the U.S. or Vietnam’s reward. We notified people about the post-test up to two times.
The conversion rates are shown in our Google spreadsheet, 2023 Randomized, Controlled Survey of 10 Weeks to Vegan Program.
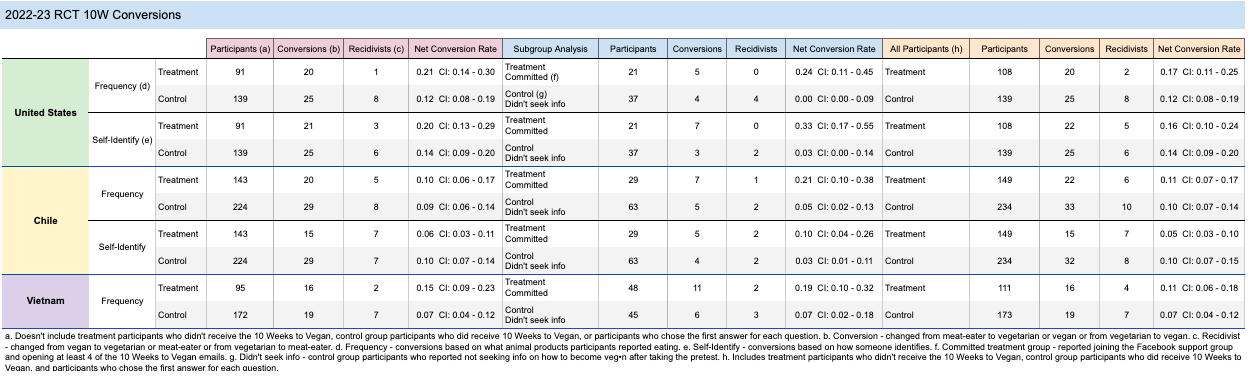
On that spreadsheet, we did three different analyses:
- Purple headings: Included all participants except the treatment participants who didn’t receive the 10 Weeks to Vegan emails, the control group participants who received the 10 Weeks to Vegan emails (by signing up in a different way), and the participants who chose the first answer for each question (which were incongruous and an indication someone was simply filling out the survey to be part of the raffle).
- Blue headings: Included only treatment group participants who reported joining the Facebook support group and opening at least 4 of the 10 Weeks to Vegan emails (the “committed group”) and control group participants who reported not seeking info on how to become veg after taking the pre-test (an “uncommitted” group).
- Yellow headings: Included all participants, even those excluded in the first (purple) analysis.
As with our previous surveys, there was a high rate of change between the pre-tests and post-tests.
Generally, for the United States and Vietnam arms, there was a difference between the treatment and control groups with mostly small overlaps between the 95% confidence intervals, giving us confidence that 10 Weeks to Vegan is having an impact.
For example, for the United States purple analysis, the treatment group had a 21% (95% CI: 14-30%) conversion rate based on diet frequency questions and a 20% (95% CI: 13-29%) conversion rate based on the identification questions, compared to the control group’s conversion rates of 12% (95% CI: 8-19%) and 14% (95% 9-20%), respectively.
In Chile, the only comparisons that showed a positive impact for the treatment group (where there wasn’t a large overlap between the confidence intervals) was in comparing the committed treatment group to the control group (for the diet frequency questions only). For the self-identify questions, the control group actually converted at a higher rate than did the treatment group (without a large overlap of confidence intervals).
Discussion
This randomized controlled survey showed that in the United States and Vietnam, participants taking part in 10 Weeks to Vegan were more likely to convert to vegetarian or vegan than participants randomized to a control group. Participants in the treatment group in Chile didn’t convert at a higher rate than the control group.
We haven’t figured out a good way to control for self-selection bias—in other words, the bias that people who are more interested in going vegan are more likely to take the survey. Making the reward higher could decrease this self-selection bias, but doing so could increase the bias that people who care about the reward—who might not be representative of the average participant in 10 Weeks to Vegan—are more likely to take the survey. In one of our past surveys, where each participant received a $5 gift card, we found a high rate of fraudulent participants.
Based partly on the results of our randomized controlled survey, we direct our ad spending for 10 Weeks to Vegan to countries where we get the most new members in our 10 Weeks to Vegan support groups; there are 49 such groups serving the many countries in which we actively promote 10 Weeks to Vegan. In 2023, we’ve averaged over 6,000 new members per month in these support groups.
In this survey, our first randomized controlled survey, we found a much higher post-test response rate among the control group. We believe this is because the treatment group’s post-test was significantly longer than the control group’s. One modification we’ll be implementing is to reduce the number of questions for the treatment group’s post-test and to allow the data to be submitted once they’ve answered the critical questions—the same questions that the control group receives.
This randomized controlled survey of 10 Weeks to Vegan is studying the impact on people who sign up through our ads but not those who, albeit in much smaller numbers, come to us organically. We’re working on ways to study those who sign up organically.
We’re in the process of adding required pre-test surveys for all 10 Weeks to Vegan participants in every country who signs up online, along with optional post-test surveys (we have no choice but to make the post-test optional). While these surveys won’t have a control group, they should allow for country-to-country comparisons and allow us to continue to monitor the program’s effectiveness.
We’re also planning a second randomized controlled survey, but it will be some time before that begins.
2022 and Previous Surveys
To assess the effectiveness of 10 Weeks to Vegan, we surveyed United States, Mexico, and India 10 Weeks to Vegan and Get Healthy participants before and after they began the email series. In order to evaluate long-term change, we sent out a follow-up survey to those in the United States for whom it has been ≥6 months since completing the series.
Methodology
The pre-test was emailed to participants within a week after they signed up for 10 Weeks to Vegan. We sent the post-test approximately two weeks after people finished the entire 10 Weeks to Vegan series. To encourage participation, we offered two randomly chosen participants per month a $50, $300 peso, or 1,500 INR, respectively, Amazon gift card.
We evaluated responses from participants who received 10 Weeks to Vegan, took both the pre-test and the post-test, and reported reading at least one email. In total, we evaluated responses from 500 US participants, 105 Mexico participants, 63 India participants, and 103 Get Healthy participants.
We asked people how often they eat various animal and plant products. The pre-test asks how often participants ate various animal products in the last month and the post-test asks how often in the last week. We follow the food intake questions with a question about whether they identify as a meat-eater, vegetarian, or vegan.
We considered those who moved from being a meat-eater to vegetarian or vegan, or from being a vegetarian to vegan, as a positive change. We classified those who moved in the reverse direction (vegan to vegetarian or meat-eater, or vegetarian to meat-eater) as a negative change. However, anyone whose self-identity was vegetarian or vegan at the pre-test and moved in a negative direction at post-test was cross-checked to see if their diet frequency showed otherwise. We counted the net changes for our total conversion figures.
For people who, based on food intake, misclassified themselves as a vegetarian or vegan in the identity question at pre-test and then reverted to a meat-eater or vegetarian at posttest, we didn’t count their reversal as a net negative. In these cases, we assume that they didn’t understand the definition of “vegetarian” or “vegan” at pre-test but then learned the definition during the series. The conversion rates would be inaccurate if we considered such people as having reverted simply because they learned the definition.
We further adjusted the results to reflect findings from the control group in our past Leafleting Effectiveness Study (LES). The LES asked the same food intake question as our 10 Weeks to Vegan surveys. We found that those in our control group had a conversion rate of 1.6%. Because we would have used this same methodology if we had a control group for our 10 Weeks to Vegan surveys, we subtracted the 1.6% rate from all our net conversion rates to arrive at the final, adjusted rates shown in the table below.
Additionally, we compared the results of those who signed up in-person versus online. In-person sources primarily came from those who signed up through public outreach on college campuses or local events. Online signups came from those who signed up via an online ad or through our website.
We determined p-values using a McNemar test comparing non-vegans at pre-test to total conversions at post-test.
Results
We received the following response rates to the surveys:
- US pre-test: 7%
- US post-test: 15.5% of those who took the pre-test
- US ≥6-months post-series follow-up: 30% of those who took the post-test
- Mexico pre-test: 10.5%
- Mexico post-test: 10% of those who took the pre-test
- India pre-test: 3%
- India post-test: 10.5% of those who took the pre-test
- Get Healthy pre-test: 9.5%
- Get Healthy post-test: 12.5% of those who took the pre-test
The adjusted conversion rates in the table below show what percentage of participants moved in a positive direction—either from meat-eater to vegetarian or vegan, or from vegetarian to vegan. In all but one instance, those who signed up online showed the greatest change.
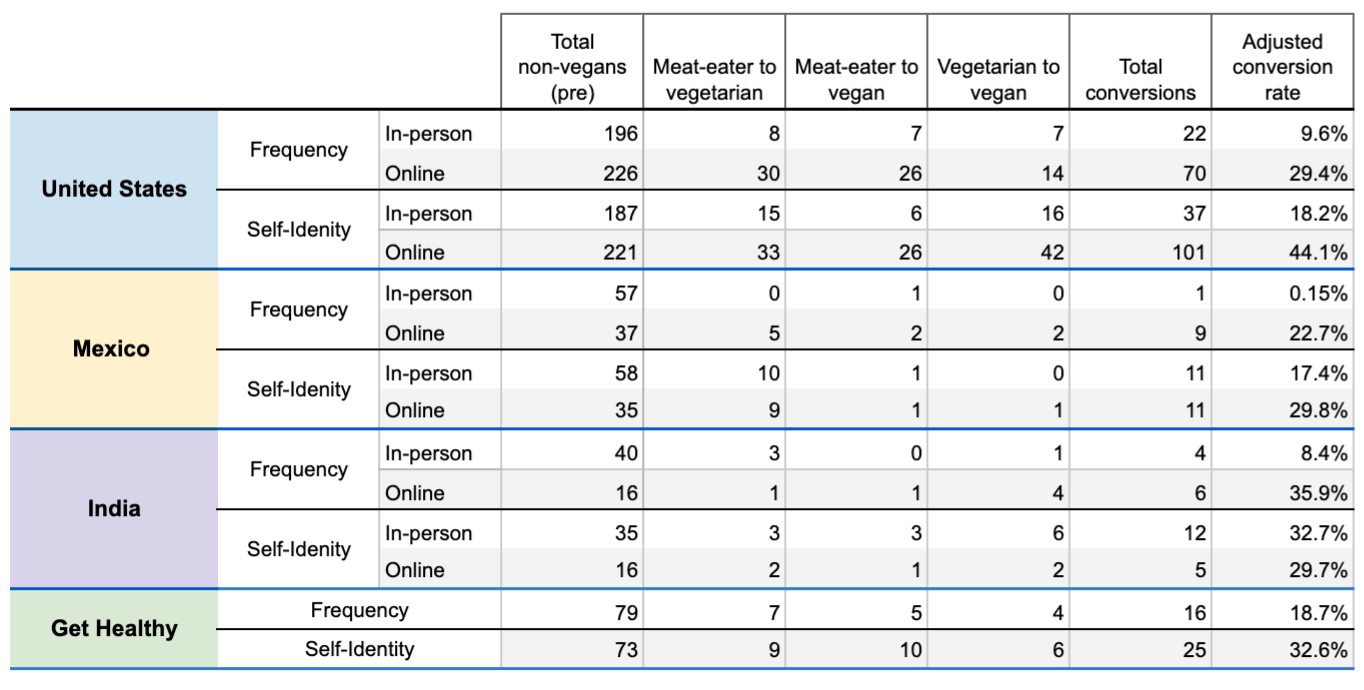
All findings for the United States 10 Weeks to Vegan and Get Healthy were statistically significant. All but the in-person diet frequency results for Mexico were statistically significant. Because the pool of respondents from India was relatively small, the findings didn’t reach statistical significance.
Follow-up Results
We followed up with 143 US participants 6 months or longer after they’d completed 10 Weeks to Vegan. The results were very encouraging. There was no statistically meaningful recidivism between the time that they completed the post-test and the follow-up survey.
There was a slight improvement in in-person outreach and a slight decrease in online. The differences between the two were only statistically significant for the self-identity question.
Below are the results from the initial pre-test to the ≥6-month follow-up survey.
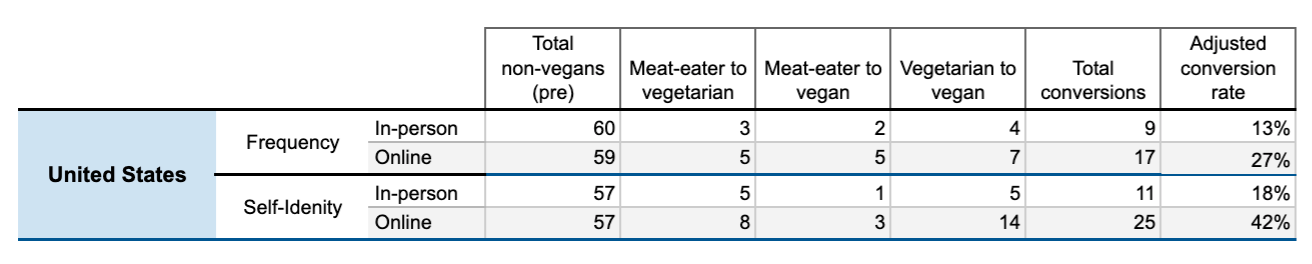
Based on this data, it appears that our work is having a lasting effect.