Going vegan reduces your environmental impact
by Jack Norris, Registered Dietitian, Executive Director of Vegan Outreach
Contents
- Introduction
- Climate and air quality
- Land and water
- Conclusion
- Appendix A: Animal agriculture’s greenhouse gas emissions
- Appendix B: Grass-fed beef and climate change
- Appendix C: Reducing U.S. greenhouse gases by going vegan
- Appendix D: Land requirements of cow’s milk vs. soymilk
- Appendix E: Plant-based diet excerpts from IPCC reports
- Bibliography
Introduction
Animal agriculture is a leading driver of greenhouse gas (GHG) emissions, air pollution, deforestation, and water use. With so many alternatives available, making choices that help the environment is easier than ever.
For example, a vegan Beyond Meat burger provides nutrition comparable to beef while cutting emissions by about 90% and energy, water, and land use by 46%, 99.5%, and 93%, respectively (Heller and Keoleian, University of Michigan, 2018).
Vegan diets have the smallest environmental footprint—lower greenhouse gas emissions and reduced land and water use—relative to an average diet, a healthy diet, a Mediterranean diet, and a healthy vegetarian diet in the United States (Jennings et al., Nutrients, 2023), and a lacto-ovo-vegetarian, a pescatarian, and a meat-containing diet in the United Kingdom (Scarborough et al., Nature Food, 2023) and Ireland (Burke et al., Environmental Research, 2025).
Even when entirely organic, meat-based diets have higher environmental impacts than plant-based diets (Rabes et al., Sustainable Production and Consumption, 2020). Dairy’s large environmental impact makes lacto-ovo-vegetarian diets more environmentally harmful than vegan diets (Kim et al., Global Environmental Change, 2020). Fishing is also implicated; commercial fishing that uses bottom trawling disturbs carbon stores in the ocean floor and significantly contributes to greenhouse gas emissions and ocean acidification (Attwood et al., Frontiers, 2024).
Climate and air quality
Peer-reviewed estimates attribute roughly 15–20% of annual global greenhouse gas emissions to animal agriculture; accounting for potential carbon sequestration on land that’s currently used for grazing and feed crops would nearly double this contribution (see Appendix A: Animal agriculture’s greenhouse gas emissions).
Limiting global warming to 1.5–2°C will likely require substantial shifts in the global food system towards plant-based diets (Clark, et al. Science, 2020). Vegan diets were found to provide the lowest per capita greenhouse gas emissions in 97% of the 140 countries studied (in 3%, a low-food-chain diet, in which insects, forage fish, and bivalves replace a portion of other animal products, had the fewest emissions; Kim et al., Global Environmental Change, 2020).
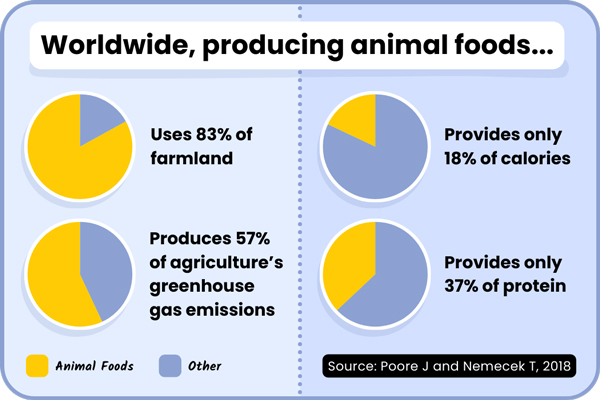
In comparing equivalent yields for protein, beef emits 90 times the greenhouse gases as peas; even the lowest-impact meat and dairy products exceed the highest-impact plants (Ritchie H, Our World in Data, 2020). Although meat, dairy, eggs, and aquaculture supply 37% of dietary protein and 18% of calories, they contribute 56–58% of food-related greenhouse gas emissions (Poore and Nemecek, Science, 2018).
Grass-fed beef is sometimes promoted as a solution to climate change. Under ideal conditions, which seldom exist, producing grass-fed beef can emit fewer greenhouse gases than feedlot beef and can also sequester carbon. Even so, it still emits substantially more greenhouse gases than producing plant-based foods and isn’t a realistic climate solution. See Appendix B: Grass-fed beef and climate change.
See Appendix C: Reducing U.S. greenhouse gases by going vegan for an explanation of a common, misleading claim that underestimates how much a vegan diet can reduce emissions in the United States.
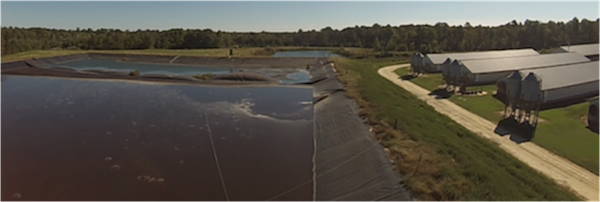
Hog and dairy farms produce enormous waste, which is often stored in lagoons and then sprayed onto fields, degrading the quality of life in nearby communities. People living near large beef, dairy, and hog farms are exposed to high levels of fine particulate matter (Chamanara et al., Communications Earth & Environment, 2025). Global adoption of vegan diets could prevent an estimated 236,000 premature deaths annually from improved air quality (Springmann et al., Nature Communications, 2023).
Land and water
Producing meat, dairy, eggs, along with aquaculture, uses about 83% of the world’s farmland but provides only 37% of the protein and 18% of the calories (Poore and Nemecek, Science, 2018). An amount of land that can produce 100 g of protein from plants can only produce 60 g from eggs, 50 g from chickens, 25 g from dairy, 10 g from pigs, and 4 g from beef cattle; in the United States, replacing animal products with nutritionally comparable plant-based alternatives could feed an additional 350 million people (Shepon et al., Proceedings of the National Academy of Sciences, 2018). One study reported that a lacto-vegetarian diet required less land than a vegan diet, but it appears to have mischaracterized the content of typical vegan diets (see Appendix D: Land requirements of cow’s milk vs. soymilk).
Globally, a diet that excludes animal products can save 19% of freshwater (Poore and Nemecek, Science, 2018). In the United Kingdom, a vegan uses only 53% as much water as someone eating a medium amount of meat (Scarborough et al., Nature Food, 2023). In the Southwestern United States, the Colorado River supports 40 million people, yet chronic overuse has depleted its reservoirs; 46% of its direct water use goes to hay for cattle (Richter et al., Communications Earth & Environment, 2024).
Conclusion
Your environmental footprint can be drastically reduced on a plant-based diet. Please see our Go Vegan section to learn how you don’t need animal foods to be healthy or to have high-protein, satisfying meals.
Appendix A: Animal agriculture’s greenhouse gas emissions
This appendix reviews estimates of animal agriculture’s annual contribution to human-driven greenhouse gas (GHG) emissions. Peer‑reviewed sources attribute approximately 15–20% of annual greenhouse gas emissions to animal agriculture; this share nearly doubles when including the carbon that could be sequestered by eliminating animal agriculture and allowing grazing and feed‑crop land to revert to its natural state.
FAO’s estimate of livestock’s greenhouse gas emissions
In 2006, the Food and Agriculture Organization (FAO) of the United Nations wrote in the Executive Summary of their report, Livestock’s Long Shadow (FAO, 2006):
The livestock sector is a major player, responsible for 18 percent of greenhouse gas emissions measured in CO2 equivalent. This is a higher share than transport.
Plant-based diet advocates widely cited the claim that animal agriculture’s emissions are higher than transport as proof that animal agriculture significantly harms the environment, though many argued that the FAO’s estimate was much too low. Seven years later, the FAO downgraded its estimate in the Overview of Tackling Climate Change Through Livestock (FAO, 2013):
With emissions estimated at 7.1 gigatonnes CO2-eq per annum, representing 14.5 percent of human-induced greenhouse gas emissions, the livestock sector plays an important role in climate change.
Since then, numerous estimates of the percentage of annual emissions attributed to animal agriculture have been published; this appendix reviews the most widely discussed estimates.
Background and terminology of greenhouse gas emissions
For anyone not familiar with the background and terminology of climate science, this section should make the estimates easier to understand.
The term greenhouse gas emissions usually refers to human-driven emissions. In this appendix, unless otherwise stated, emissions refer to human-driven greenhouse gas emissions, and the percentage of emissions attributable to animal agriculture is on an annual basis.
Water vapor is the most common greenhouse gas, responsible for approximately half of the heat trapped in the Earth’s atmosphere (MIT Climate Portal, 2023). The only direct, significant production of water vapor from human activity is from contrails—water vapor that forms behind high-flying jet planes that persist under some conditions (Yale Environment 360, 2019). Water vapor usually isn’t included in greenhouse gas estimates, which focus on the other three most prevalent greenhouse gases: carbon dioxide (CO2), methane (CH4), and nitrous oxide (N2O). While water vapor usually isn’t included in estimates of human-driven greenhouse gases, it’s increasing in the atmosphere due to the warming of the oceans driven by human-caused global warming (NASA, 2024).
Annually, the amount of CO2 naturally released into the atmosphere, approximately 210 Gt of carbon (769 Gt of CO2), is many times greater than that released by human activities. Because this CO2 is in balance with what’s removed from the air, mainly by photosynthesis (Carbon Flux, University of Calgary), it’s not included in estimates of greenhouse gas emissions. To compare, the amount of human-driven emissions in 2023 was 54 Gt of CO2 equivalents (Ritchie, 2024; using GWP-100).
Until 1750, the atmospheric concentrations of the two leading greenhouse gases, CO2 and methane, remained stable: they were emitted into the atmosphere and removed in about equal amounts. After 1750, human activity has steadily increased CO2 levels, mainly through the burning of fossil fuels and, to a lesser extent, deforestation.
Humans have also increased the amount of methane in the atmosphere by raising large numbers of ruminant livestock and rice, creating landfills, and burning natural gas (which is 70–90% methane; NASA, 2024). By raw weight, methane has a much higher, short-term warming impact than CO2; because of this, even if ruminant animals are raised in a carbon-neutral system (where the amount of carbon they release is equal to the amount of carbon removed by photosynthesis by the plants they eat), they’ll still contribute to global warming.
Global warming potential (GWP) of methane
Greenhouse gases aren’t measured by the quantity of molecules, but rather by mass. The masses of different gases aren’t commonly compared in a one-to-one ratio; rather, they’re adjusted to reflect their contributions to global warming relative to CO2 by multiplying their mass by a global warming potential (GWP), which can vary depending on the timeframe being considered. By convention, CO2 is assigned a GWP of 1.
Methane’s tetrahedral shape gives it more ways to absorb infrared light than CO2’s linear structure (MIT Climate Portal, 2023). Per mass, methane also has 2.7 times as many molecules as CO2, but I haven’t seen this cited as a basis for adjusting its GWP.
Most climate change models use a 100-year timeframe, expressed as GWP-100. Methane’s GWP-100 is about 28. To calculate the amount of methane “emissions” produced by an activity, its mass is multiplied by 28, stated in CO2 equivalents (CO2eq or CO2e).
Atmospheric methane degrades to CO2 in 7–12 years, whereas CO2 doesn’t degrade for hundreds of years (NASA, 2025). This means that using a GWP timeframe of 10–20 years, rather than 100 years, increases the amount of CO2eq represented by methane. Methane’s GWP-20 is about 84 (IPCC 2013 AR5 WG1 Table 8.7).
Climate scientists recognize that 100 years is somewhat arbitrary. Some advocates maintain that we need to act within a short timeframe to curb climate change and, therefore, a GWP-20 is more appropriate. Since methane is a large portion of animal agriculture’s emissions, they argue that when using a GWP-20, animal agriculture accounts for a significantly higher amount of global emissions. However, this doesn’t actually appear to be the case. Animal agriculture emits 37% (Goodland and Anhang, 2009, p. 13) to 44% (FAO, 2013, 3.1, p. 15) of global methane and given the current mixture of greenhouse gases from various sectors, switching from GWP-100 to GWP-20 doesn’t drastically increase the percentage of its global emissions.
Goodland and Anhang (2009) of World Watch wrote a well-known critique of the FAO’s estimate. They used a GWP-20, which increased methane emissions from animal agriculture from 2.4 to 7.4 Gt CO2eq. However, they didn’t apply a GWP-20 to methane from other sources, saying, “Further work is needed to recalibrate methane emissions other than those attributable to livestock products using a 20-year timeframe (p. 14).” I estimate these additional methane emissions to be 8.6 Gt CO2eq (calculations). For this and other reasons, Goodland and Anhang conclude that at least 51% of annual global greenhouse gas emissions are attributable to livestock products, but this percentage decreases to 44% when additional methane emissions are included.
One way to estimate the impact of methane without needing a GWP factor is to use radiative forcing. I do this below in Radiative forcing.
Carbon opportunity cost (COC)
Another consideration is that much of the land currently used for grazing animals and growing animal feed could be reverted to forests and grasslands, which could store massive amounts of carbon, a process known as carbon sequestration or the carbon opportunity cost (COC).
The FAO’s estimate of animal agriculture’s contribution to greenhouse gas emissions doesn’t include any amount for COC. In contrast, Goodland and Anhang include a significant amount of COC (11.4 Gt CO2eq per year). Another critique of the FAO is provided by Rao (2020), who adds 34.5 Gt CO2eq per year to animal agriculture’s emissions, resulting in an estimate that animal agriculture is responsible for at least 87% of annual emissions.
Hayek et al. (Nature Sustainability, 2021) estimate that animal agriculture is responsible for a total (as distinct from per year) COC of 152.5 Gt of carbon (559 Gt CO2) and, as a result, replacing animal agriculture with a vegan diet could sequester 547 Gt CO2; this would have to be done over the course of many years. Poore and Nemecek (Science, 2018) estimate that if the food system were completely plant-based, 8.1 Gt CO2 could be sequestered annually for 100 years, for a total of 810 Gt CO2.
Other estimates of animal agriculture’s emissions
This section reviews notable estimates of animal agriculture’s contribution to greenhouse gas emissions. Table A.1 includes peer-reviewed estimates that provide, or allow for the easy calculation of, the percentage of greenhouse gas emissions from animal agriculture; similar reports reviewed below lacked the detail needed for inclusion in Table A.1.
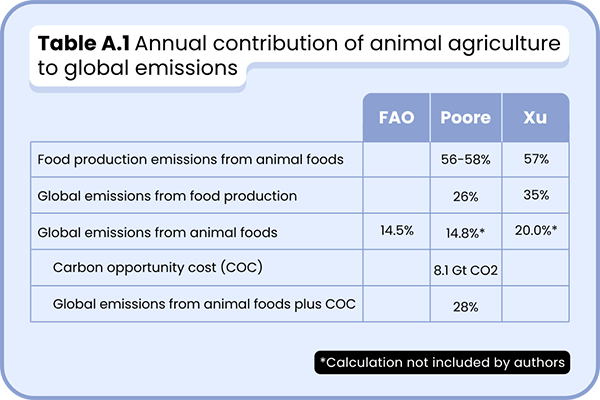
Poore and Nemecek (Science, 2018) conducted an in-depth analysis of the lifecycles for a wide range of foods (based on GWP-100), and estimate that animal foods account for 56–58% of food-related emissions. With food production accounting for 26% of total emissions, animal foods are responsible for 15% of total emissions. As mentioned previously, Poore and Nemecek also estimate that 8.1 Gt of CO2eq could be sequestered per year if the food system were completely plant-based, resulting in “a 28% reduction in global greenhouse gas emissions across all sectors of the economy relative to 2010 emissions.”
Xu et al. (Nature Food, 2021) quantified CO2, methane, and nitrous oxide emissions from the production and consumption of all foods using a method that “builds upon and extends the data and methods published in the literature by implementing them into the Integrated Science Assessment Model (ISAM).” In other words, they attempted a more comprehensive accounting and categorization of greenhouse gases than previous estimates. Using a 100-year GWP, Xu et al. estimate that animal foods account for 57% of food-related emissions and that food production accounts for 35% of total greenhouse gases, making animal foods responsible for 20% of the total.
Twine (Sustainability, 2021) argues that the FAO’s analysis doesn’t always use the same sources and years for livestock emissions as it does for total emissions. After matching them, animal agriculture accounts for at least 16.5% of total emissions.
The Intergovernmental Panel on Climate Change (IPCC) is widely regarded as the most authoritative source on climate change. The IPCC regards plant-based diets as a generally effective way to reduce emissions, where they can be implemented and if low-emission plant-based foods replace animal foods (see Appendix E: Plant-based diet excerpts from IPCC reports). They cite Springmann et al. (2016) in estimating that vegan diets could reduce annual emissions by about 8.0 Gt CO2eq (IPCC 2019 Synthesis Report: Climate Change and Land, Figure 5.12, p. 488). The IPCC doesn’t address COC.
Springmann et al. (Nature Communications, 2023) estimate that switching to a vegan diet could reduce global agricultural emissions by 84–86% in 2030, apparently on an annual basis. They appear to use a GWP-100 without including any COC. Using Poore and Nemecek’s estimate that food production is 26% of total emissions, changing to a vegan diet could reduce total greenhouse gases by about 22%, not including COC.
Wedderburn-Bisshop (Environmental Research Letters, 2025) estimates the cumulative increase in greenhouse gas emissions from various sectors between 1750 and 2020, finding that agriculture has been responsible for 60% and animal agriculture responsible for 86% of agricultural emissions, making animal agriculture responsible for 52% during that period. Wedderburn-Bisshop’s methods differ from other estimates by using gross emissions from land-use changes (rather than net-emissions), using radiative forcing rather than a GWP, and including cooling and warming from aerosols.
Radiative forcing
Radiative forcing refers to the heating (or cooling) effect caused by gases in the atmosphere, and is often mentioned in discussions of animal agriculture’s climate impact. Because I haven’t found a peer‑reviewed estimate of animal agriculture’s annual contribution to radiative forcing, I estimate its contribution to the radiative forcing of the three main human-driven greenhouse gases (CO2, CH4, and N2O) below. Using radiative forcing avoids the need to select a GWP timeframe; however, because radiative forcing is time‑dependent, a single‑year estimate doesn’t capture the longer‑term impact.
The EPA provides a table of the annual increases in radiative forcing for the various greenhouse gases. CO2, methane, and nitrous oxide account for 98.8% of radiative forcing (calculations). Averaging the annual increase of radiative forcing of these gases for the most recent 10 years of data (2014-2023) and multiplying by the proportion of that gas’s emissions that come from animal agriculture suggests that the annual fraction of the radiative forcing of CO2, methane, and nitrous oxide attributable to animal agriculture is 13% (calculations).
For this estimate, I had to use the FAO’s percentages of CO2 contributed by animal agriculture, which would be considered too low by some (Goodland and Anhang, 2009). Including COC would result in a 27% mitigation of annual emissions by eliminating animal agriculture (calculations).
The net radiative forcing of the planet can be affected by aerosols, which can cool or warm, depending on the type and color of the particle (NASA, 2023). Although aerosols affect global warming, I haven’t seen a model that quantifies their net impact across sectors on an annual basis. Wedderburn-Bisshop (2025) includes aerosols in his estimate of cumulative emissions from 1750 to 2020, attributing a 70% degree of uncertainty to their radiative forcing.
My estimate that animal agriculture accounts for 13% of the radiative forcing of CO2, CH4, and N2O is relatively close to Poore and Nemecek’s estimate that animal agriculture’s share of emissions is 14.8%, indicating little difference when using radiative forcing.
Conclusion
The share of annual emissions attributed to animal agriculture varies depending on what is included, with COC being the largest variable. Peer-reviewed sources estimate that animal agriculture accounts for approximately 15–20% of annual greenhouse gas emissions. This amount can be approximately doubled if the land used for animal agriculture is allowed to revert to its natural state.
Appendix B: Grass-fed beef and climate change
Most U.S. beef cattle spend their final months on feedlots, “finished” on grain; other cattle, known as grass-fed, eat only forage their entire lives and typically spend most of that time on pasture (USDA rules only require pasture access during the growing season, defined as the frost-free period; Vol. 72, No. 199, October 16, 2007). The forage that grazing cattle eat generates more methane than does feed, and because grazing cattle grow more slowly than feedlot‑finished cattle, they emit more methane for a longer period. While feedlot‑finished beef has substantially higher greenhouse gas emissions than plant-based foods, it typically has lower emissions than grass-fed beef.
Despite grass-fed beef’s typically higher methane production, some argue it can be a climate solution. The idea gained momentum from biologist Allan Savory’s 2013 TED Talk, How to green the world’s deserts and reverse climate change. Savory claims desertification is a major driver of climate change (through loss of carbon into the atmosphere), but that blaming livestock grazing is misleading. He says the way to combat desertification is to use livestock to mimic the historic, tightly bunched, migrating herds of wild ruminants on grasslands. He developed methods for ranchers to do this and showcases dramatic before-and-after images of formerly desertified land that had been turned into grasslands. Savory suggests that applying his methods to half the world’s grasslands offers the best hope for addressing climate change.
Is Savory correct?
To combat climate change, grazing must yield a net reduction of CO2-equivalent emissions. Carbon is part of a cycle in which plants absorb carbon as CO2, and then animals eat the plants and either store their carbon in tissues or emit it as CO2 and methane. Carbon sequestration—the long-term storage of carbon in soils and plants—is the only way in which grass-fed beef can decrease atmospheric carbon. Carbon sequestration can occur when soils increase the amount of organic matter and dung, grasses grow deeper roots, or additional non-grazed plants thrive. But there’s a key limit: only carbon-depleted soils can store much additional carbon, and once they approach saturation, grazing systems will no longer be negative carbon emitters. Additionally, methane is a carbon-based gas that is more potent but shorter-lived than CO2 (it degrades to CO2 after 7–12 years; NASA, 2025). For a grazing system to reduce global warming, it would have to sequester enough carbon to offset the additional warming caused by the methane it emits.
How much carbon can improved grazing actually sequester? Extensive research says: not much.
Eshel et al. compared grass-fed to industrial beef and other proteins (Proceedings of the National Academy of Sciences, 2025) and concluded that even with optimistic rangeland sequestration, grass-fed beef isn’t less carbon-intensive than industrial beef and is 3–40 times as carbon-intensive as most plant and animal alternatives.
Cusack et al. analyzed 292 comparisons across regions (Global Change Biology, 2021) and found that while efficiency gains and land-based carbon sequestration can reduce beef’s emissions, expecting maximal global adoption is unrealistic; therefore, such strategies should complement efforts to curb the growing demand for beef.
Due to lower productivity, a nationwide shift to grass-fed beef at the current U.S. consumption rate would require about 30% more cattle, increasing environmental impacts (Hayek and Garrett, Environmental Research Letters, 2018).
The Food Climate Research Network’s Grazed and Confused (2017) report notes that well-managed systems can sequester some carbon, sometimes offsetting emissions, yet concludes that grass-fed livestock aren’t a climate solution. As lead author Dr. Tara Garnett puts it: “Ultimately, if high consuming individuals and countries want to do something positive for the climate, maintaining their current consumption levels but simply switching to grass-fed beef is not a solution. Eating less meat, of all types, is (press release).”
In summary, under ideal conditions that seldom exist, grass-fed beef might emit fewer greenhouse gases than feedlot beef and may sequester carbon for a time. But even grass-fed beef emits substantially more greenhouse gases than plant-based foods and is not a realistic climate solution.
Appendix C: Reducing U.S. greenhouse gases by going vegan
An article in Newsweek, Don’t bother going vegan to save the planet. Do this instead (January 25, 2025), says that if everyone in the United States went vegan, the country’s greenhouse gas (GHG) emissions would decrease by only 2.6%. The author cites an article from the Clarity and Leadership for Environmental Awareness and Research (CLEAR) Center at UC Davis, What if the United States stopped eating meat? (December 20, 2020):
In 2017, Professors Mary Beth Hall and Robin White published an article regarding the nutritional and greenhouse gas impacts of removing animals from U.S. agriculture. Imagining for a moment that Americans have eliminated all animal protein from their diets, they concluded such a scenario would lead to a reduction of a mere 2.6 percent in greenhouse gas (GHG) emissions throughout the United States.
CLEAR’s description of White and Hall’s analysis is misleading. White and Hall determined the amount of greenhouse gases that would be reduced if all animal agriculture were replaced by plant agriculture, at maximum U.S. agricultural capacity. However, if everyone in the United States went vegan, U.S. agriculture could reduce operations (and emissions) while feeding the same number of people.
Here are some estimates for how much vegan diets can reduce greenhouse gases in the United States:
- Poore and Nemecek (Science, 2018) estimate that the population becoming vegan could reduce food-related emissions by 77%.
- Heller et al. estimate that replacing half of all animal foods with plant foods could result in a 35% decrease in diet-related emissions, and, thus, about 70% if all animal foods were replaced (Center for Sustainable Systems, University of Michigan, 2020).
- Figure 4 of White and Hall’s paper suggests that a theoretical, plant-only diet produces 70–71% fewer emissions than the current meat-based diet.
The Environmental Protection Agency reports that “In 2022, direct greenhouse gas emissions from the agriculture sector accounted for 9.4% of total U.S. greenhouse gas emissions.” Thus, a 70–77% reduction in food-related emissions would yield a 6.6–7.2% reduction in total emissions (in contrast to the 2.6% cited by Newsweek).
To put this reduction in context, in April 2021, the Biden Administration set a goal for the United States to reduce greenhouse gas pollution by 50–52% by 2030 (White House Fact Sheet, 2021).
It’s possible that the 6.6–7.2% number is an underestimate. Bottom-up models are used to estimate agricultural emissions in this appendix. Hayek (2020) finds that top-down atmospheric measurements suggest US animal agriculture methane emissions are 39–90% higher than bottom-up models predict, possibly because real-world manure emissions exceed lab-based estimates, and because animal infections in intensive facilities may increase enteric methane output.
Two weeks after running Don’t bother going vegan, Newsweek published the following in their article, Even one person’s food choices affect the whole planet (February 14, 2025):
Frequently, veganism is compared to recycling, as both are seen as individual actions that have limited effects. Building a plant-forward food economy is not, however, structurally comparable to recycling. Recycling is a downstream effort to mitigate the damage of a throwaway society. Veganism is an upstream effort to shrink the size of the animal agriculture industry by reducing demand for its products.
For the United States to meet its climate goals, most of the emission reductions must come through government policy and industry. But in terms of things the average person can do, switching to a plant-based diet is one of the most impactful.
Appendix D: Land requirements of cow’s milk vs. soymilk
One study analyzed 10 different diet scenarios and found that a lacto-vegetarian diet required the least land, even lower than a vegan diet (Peters et al., Elementa: Science of the Anthropocene, 2016).
The main difference between the two diets was that they assigned 4 cups of dairy to lacto-vegetarians and 2.9 cups of soymilk to vegans, suggesting that their model must allocate more land to producing soymilk than to producing dairy.
Vegans don’t typically consume such large amounts of soymilk, but, more importantly, dairy requires 14 times as much land per volume of milk (Ritchie, Our World in Data, 2022).
Appendix E: Plant-based diet excerpts from IPCC reports
IPCC reports are typically written by numbered working groups (WG) for numbered assessment reports (AR) or special reports (SR), including:
- AR4 WG3 2007 Mitigation of Climate Change (863 pages)
- AR5 WG1 2013 The Physical Science Basis (1,552 pages)
- AR5 WG3 2014 Mitigation of Climate Change (1,454 pages)
- SR 2019 Climate Change and Land (908 pages)
- AR6 Synthesis (WG1, WG2, WG3) 2023 Report (186 pages)
Below are all the excerpts from the above reports that address plant-based diets, along with the sources and my comments where relevant.
The IPCC’s 2023 AR6 Synthesis Report says little about climate change and diet. I was unable to search the individual reports (WG1 2021, WG2 2022, WG3 2023) due to their massive length, which created data resource issues.
The IPCC’s 2019 IPCC Special Report: Climate Change and Land provides three relevant figures:
- Figure TS.5 (p. 48) provides a graph for Diets under Demand Management, which references eight studies used to determine a range of 0.7–8.0 Gt CO2eq that could be eliminated by transitioning to plant-based diets.
- Note: Roe et al. (2017) are cited for this graph: A shift to healthy, plant-based diets has the potential to reduce these [greenhouse gas] emissions by 2.15–5.8 Gt CO2e a year, with the lower figure representing a healthy diet and the higher figure representing a vegetarian diet.
- Figure 2.24 (p. 190) is another chart that includes the same Diets graph as Figure TS.5, this time including the sources listed in the paper by Roe et al. (2017).
- Figure 5.12 (p. 488) presents a bar graph that breaks down the different diets used in the smaller graph of Diets provided in Figures TS.5 and 2.24. It shows the amount of emissions that could be reduced by way of various diets, with a vegan diet reducing the most, close to 8.0 GtCO2-eq per year, citing Springmann et al. (2016) and Stehfest et al. (2009):
- Springmann et al. (2016) estimate that, under a model of eliminating animal-based foods, annual greenhouse gas emissions would be reduced to 8 Gt CO2eq by 2050. Possibly worth noting is that their model estimated annual food-related emissions for 2005/2007 to be 7.6 Gt CO2eq, which is low compared to other sources described in Twine (2021) and the IPCC SR 2019 Table SPM.1, which lists 10.8–19.1 Gt CO2eq for the annual global food system average from 2007-2016.
- Figure 2a of Stehfest et al. (2009) indicates, by eyeballing their graph, that a move towards no animal products would reduce annual emissions by 5 Gt CO2eq in 2030 and by 2.1 Gt CO2eq in 2050. The lower amount for 2050 is presumably due to projected increases in efficiency in producing animal products.
Other excerpts from the 2019 IPCC Special Report: Climate Change and Land:
- Summary for Policymakers (p. 24 paragraph B.6.2.): Balanced diets, featuring plant-based foods, such as those based on coarse grains, legumes, fruits and vegetables, nuts and seeds, and animal-sourced food produced in resilient, sustainable and low-GHG emission systems, present major opportunities for adaptation and mitigation while generating significant co-benefits in terms of human health (high confidence). By 2050, dietary changes could free several million km2 (medium confidence) of land and provide a technical mitigation potential of 0.7 to 8.0 GtCO2eq yr-1, relative to business as usual projections (high confidence).
- Chapter Two, p. 136: The largest potential for reducing AFOLU [Agriculture, Forestry and Other Land Use] emissions are through reduced deforestation and forest degradation (0.4–5.8 GtCO2-eq yr–1) (high confidence), a shift towards plant-based diets (0.7–8.0 GtCO2-eq yr–1) (high confidence) and reduced food and agricultural waste (0.8–4.5 GtCO2-eq yr–1) (high confidence).
- Chapter Two, p. 195: Shifting to diets that are lower in emissions-intensive foods like beef delivers a mitigation potential of 0.7–8.0 GtCO2-eq yr–1 (high confidence) (Bajželj et al. 2014; Dickie et al. 2014; Herrero et al. 2016; Hawken 2017; Springmann et al. 2016; Tilman and Clark 2014; Hedenus et al. 2014; Stehfest et al. 2009) with most of the higher end estimates (>6 GtCO2-eq yr–1) based on veganism, vegetarianism or very low ruminant meat consumption (Section 5.5.2).
- Chapter 5, p. 481: Whilst sustainable diets need not necessarily provide more nutrition, there is certainly significant overlap between those that are healthier (e.g., via eating more plant-based material and less livestock-based material), and eating the appropriate level of calories. In their systematic review, Nelson et al. (2016) conclude that, in general, a dietary pattern that is higher in plant-based foods, such as vegetables, fruits, whole grains, legumes, nuts, and seeds, and lower in animal-based foods is more health-promoting and is associated with lesser environmental impact (GHG emissions and energy, land, and water use) than is the current average ‘meat-based’ diet.
- Commenting on Figure 5.12 (p. 490): Figure 5.12 shows the technical mitigation potentials of some scenarios of alternative diets examined in the literature. Stehfest et al. (2009) were among the first to examine these questions. They found that under the most extreme scenario, where no animal products are consumed at all, adequate food production in 2050 could be achieved on less land than is currently used, allowing considerable forest regeneration, and reducing land-based GHG emissions to one third of the reference ‘business-as-usual’ case for 2050, a reduction of 7.8 GtCO2-eq yr–1. Springmann et al. (2016b) recently estimated a similar emissions reduction potential of 8 GtCO2-eq yr–1 from a vegan diet without animal-sourced foods. This defines the upper bound of the technical mitigation potential of demand side measures.
- I’m not sure where the IPCC obtained the value of 7.8 from Stehfest et al. (2009). As mentioned above, Stehfest et al.’s Figure 2a suggests a decrease in total GHG emissions of 5 Gt CO2eq in 2030 and 2.1 Gt CO2eq in 2050. Figure 2.b provides a graph of land use reductions in GHG emissions, which, at its widest margin (2035), indicates a reduction of 4 Gt CO2eq.
- Chapter 5 (p. 490): Studies have defined dietary mitigation potential as, for example, 20 kg per person per week CO2-eq for Mediterranean diet, versus 13 kg per person per week CO2-eq for vegan (Castañé and Antón 2017). Rosi et al. (2017) developed seven-day diets in Italy for about 150 people defined as omnivore 4.0 ± 1.0; ovo-lacto-veggie 2.6 ± 0.6; and vegan 2.3 ± 0.5 kg CO2-eq per capita per day.
The most relevant mention from the IPCC’s AR5 WG3 2014 report is on p. 869:
- Changes in diet towards plant-based and hence less GHG-intensive food can result in GHG emission savings of 0.7 – 7.3 GtCO2eq / yr in 2050, depending on which GHGs and diets are considered.
Bibliography
Burke DT, Hynds P, Priyadarshini A. Evaluating the GHG emissions, land use, and water use associated with contemporary dietary patterns in the Republic of Ireland. Environ Res. 2025 Jan 30:120974. Pescatarian diets used slightly less water than a vegan diet, both of which used less than other diets.
Eisen MB, Brown PO. Rapid global phaseout of animal agriculture has the potential to stabilize greenhouse gas levels for 30 years and offset 68 percent of CO2 emissions this century. PLOS Climate 2022 1(2): e0000010. Eisen and Brown are associated with Impossible Foods, a company that makes plant-based meats. They found in their analysis that if animal agriculture were phased out over the span of 15 years, greenhouse gas emissions could stabilize for 30 years and offset 68% of carbon dioxide emissions through the remainder of this century. The resulting greenhouse gas reductions would provide half of those necessary to limit global warming to 2°C.
Environmental Protection Agency. Agriculture Sector Emissions. Updated January 16, 2025.
Eshel G, Martin PA. 2006: Diet, Energy, and Global Warming. Earth Interact., 10, 1–17. Estimates that changing from the average American diet to a vegan diet reduces emissions by 41% more than switching from driving a Toyota Camry to a Toyota Prius and 40% as much as switching from an SUV to a Prius. In 2025, the miles per gallon for similar vehicles have changed to the point that this analysis is no longer applicable.
Eshel G, Stainier P, Shepon A, Swaminathan A. Environmentally Optimal, Nutritionally Sound, Protein and Energy Conserving Plant Based Alternatives to U.S. Meat. Scientific reports. 2019 Aug 8;9(1):1-1. Estimate that replacing all meat with plant foods in the United States (on a per-protein basis) would result in an almost 40% reduction in dietary and a 5% reduction in overall emissions; doesn’t include replacing dairy and eggs (Figure 2.e).
Food and Agriculture Organization of the United Nations (FAO). Livestock’s Long Shadow. 2006. PDF.
Goodland R, Anhang J. Livestock and Climate Change. World Watch. Nov/Dec 2009;10-19. PDF.
Heller M, Keoleian G, Rose D. Implications of Future US Diet Scenarios on Greenhouse Gas Emissions. CSS Report, University of Michigan: Ann Arbor 2020 Jan 13;1-24. In the United States, replacing half of all animal-based foods with plant-based foods could reduce about 224 million metric tons of emissions annually by 2030, the same amount as 47.5 million passenger vehicles.
Humpenöder F, Popp A, Merfort L, Luderer G, Weindl I, Bodirsky BL, Stevanović M, Klein D, Rodrigues R, Bauer N, Dietrich JP, Lotze-Campen H, Rockström J. Food matters: Dietary shifts increase the feasibility of 1.5°C pathways in line with the Paris Agreement. Sci Adv. 2024 Mar 29;10(13):eadj3832. A global shift towards a flexitarian diet by 2050 would make it possible to limit global warming to 1.5°C.
Kozicka M, Havlík P, Valin H, Wollenberg E, Deppermann A, Leclère D, Lauri P, Moses R, Boere E, Frank S, Davis C, Park E, Gurwick N. Feeding climate and biodiversity goals with novel plant-based meat and milk alternatives. Nat Commun. 2023 Sep 12;14(1):5316. Globally, replacing 50% of animal-sourced foods with plant-based alternatives would reduce agricultural and land use (deforestation) emissions by 31% by 2050, while also increasing food security. Two of the 13 authors had connections to Impossible Foods, a manufacturer of plant-based meats.
National Aeronautics and Space Administration (NASA). Methane. Last updated: September 2025.
National Oceanic & Atmospheric Administration (NOAA). Basics of the Carbon Cycle and the Greenhouse Effect. Provides a concise explanation of greenhouse gases and the carbon cycle.
Pohl E, Lee SR. Local and Global Public Health and Emissions from Concentrated Animal Feeding Operations in the USA: A Scoping Review. Int J Environ Res Public Health. 2024 Jul 13;21(7):916.This review found higher rates of mortality, infant mortality, and respiratory diseases for people living close to factory farms, but the data was all cross-sectional.
Shepon A, Eshel G, Noor E, Milo R. The opportunity cost of animal based diets exceeds all food losses. Proceedings of the National Academy of Sciences. 2018 Apr 10;115(15):3804-9. The protein produced on the same amount of land for different foods comes from Figure 3.
Son JY, Miranda ML, Bell ML. Exposure to concentrated animal feeding operations (CAFOs) and risk of mortality in North Carolina, USA. Sci Total Environ. 2021 Dec 10;799:149407. Cross-sectional study found slightly elevated cardiovascular mortality among populations with high CAFOs exposure (1.06, 95% CI: 1.05, 1.07). Overall mortality not reported.
Springmann M, Clark M, Willett W. Feedlot diet for Americans that results from a misspecified optimization algorithm. Proc Natl Acad Sci U S A. 2018 Feb 20;115(8):E1704-E1705. Suggest that White and Hall (2017) may have double-counted the GHG emissions required in producing nitrogen fertilizer for their plants-only analysis.
Tompa O, Lakner Z, Oláh J, Popp J, Kiss A. Is the Sustainable Choice a Healthy Choice?-Water Footprint Consequence of Changing Dietary Patterns. Nutrients. 2020 Aug 25;12(9):2578. Modeled the water footprint of various diets based on food intake patterns in Hungary. Found a vegan diet to have the smallest water footprint but considered a vegan diet too impractical due to nutrient inadequacy and cultural acceptability.
University of Calgary. Energy Education. Carbon Flux. Accessed October 2025.