There is an updated version of this article that includes our Spring 2018 Leafleting Effectiveness Study results.
By Jack Norris, Executive Director
People have always asked us at Vegan Outreach how we know whether leafleting makes a difference.
We have mainly had anecdotal evidence to provide them, such as the Lives Changed page on our website, which shows many people who have changed their diets due to receiving a booklet.
The impact that can be palpably felt on college campuses when leafleting—by talking to interested students, seeing people reading the booklets, and overhearing people discuss the issue—typically leaves an activist with a strong sense that they have just done a lot of good. These feelings are what keep so many leafleters going out day after day.
Nonetheless, it would be great to have more precise information about the impact of leafleting. This is no easy task, since there are at least four scenarios where leafleting is likely to make a positive difference.
- Direct Diet Change: A person receiving a booklet is moved emotionally or intellectually by the suffering of farmed animals and adopts a vegan diet.
- Word of Mouth: The original booklet recipient shares that information with others either through conversation or passing along the booklet.
- Touchpoint: A person is made aware of the suffering of farmed animals by a booklet, which makes them more likely to change their diet when presented with a future outreach activity.
- Animal Protection Community-Building: Leafleting is a low barrier-to-entry activity for new and experienced animal activists alike. Taking part in leafleting outings builds important connections between people and organizations in the animal protection community.
Historically, studies on leafleting have focused on the first scenario (direct diet change). Vegan Outreach’s current efforts are also focused on determining how likely people are to change their diet after receiving a booklet. However, to get a full understanding of the benefits of leafleting, these other dimensions have to be taken into consideration, and may themselves be subjects for future investigations.
Previous Studies on Leafleting
There have been two studies that have attempted to measure the impact of leafleting on diet change, both released in 2013. One study was performed by Farm Sanctuary and The Humane League (link) and the other was performed by Animal Charity Evaluators (link).
Both studies found support that leafleting leads to diet change, but they didn’t have many statistically significant findings. They also didn’t use a pre-test/post-test model in which diet change was measured before and after treatment—something I believe to be fairly important before any confident conclusions can be drawn.
There has been one additional study (released in 2015) that was similar to leafleting on college campuses. The Humane League went to colleges and asked students to take a food frequency survey after which they were given a booklet. The students were contacted a few months later and given a follow-up food frequency survey. The intent of the study was to see how four different messages, and no message at all for a control group, impacted dietary change.
The study had between 126 and 149 students in each treatment group and 57 in the control. Surprisingly, they found that the control group reduced their animal product consumption more than the treatment groups. But, in any case, this study tested responses to booklets among people who stopped to take the survey and might not apply to leafleting (PDF).
Pilot Trial One—Fall 2015
Vegan Outreach’s first attempt at a Leafleting Effectiveness Study (LES) was a bit of a shot in the dark since we had no idea what the response would be.
It took place in the fall of 2015. We gave out 5,000 copies of our Your Choice booklet, 500 per school at 10 schools, and 1,000 control brochures (about charitable giving that didn’t mention animals) at one school.
Each booklet had a sticker on the front that asked students to take a 2-part survey to receive a $5 gift certificate to either Amazon or Starbucks. The survey measured their animal product consumption along with a few other questions.
Results of the Pre-Test
Of the treatment group, 88 respondents (1.8% of the people who received a booklet) took the pre-test, while 16 respondents (1.6%) from the control group took the pre-test.
We felt that this similarity in response rates suggested that people who cared about farmed animals were no more likely to respond to the survey than those who didn’t; thus, there was no evidence of bias in favor of farmed animals.
Among the treatment group, about 50% of the participants said reading the booklet made them want to eat fewer mammals and birds, and 35-40% wanted to eat less eggs, dairy, and fish. 70% of the respondents discussed the booklet with other people and 80% said they’re now more sympathetic to farmed animals.
I was quite heartened by these results. While they cannot necessarily be extrapolated to the entire population who received the booklets, they indicate that the booklets are impacting some people in a positive way.
Comparisons Between Leafleting and Videos
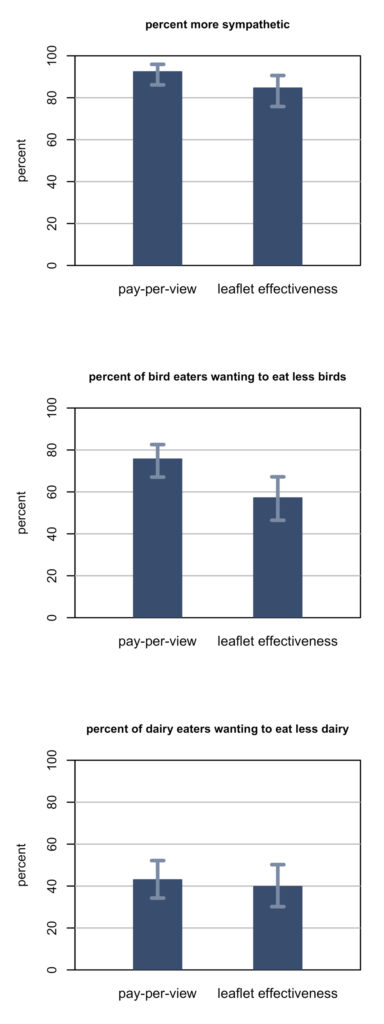
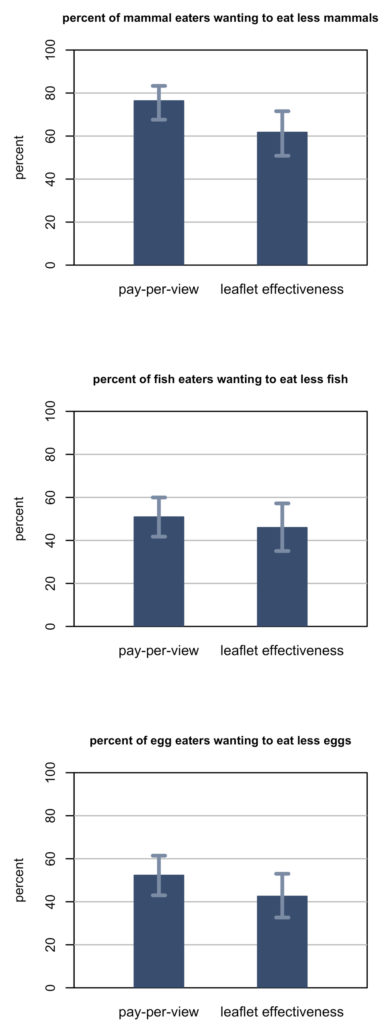
Also in the fall of 2015, we did some Pay Per View testing at two different universities among students who were paid a small amount ($1-3) to watch a video on farmed animal treatment. 118 people finished the surveys, and we compared the results to the fall 2015 LES study mentioned above. A comparison of the pre-test results from the video study with the pre-test results from the leafleting study is provided in the graphs below.
To summarize, among those who responded to the leafleting surveys, the results were on average not quite as good as for videos, but the differences were not statistically significant.
I find the graph on “dairy eaters wanting to eat less dairy” particularly interesting because neither the video nor the booklet discussed the treatment of dairy cows and yet 40 percent of respondents wanted to eat less dairy.
In the charts below, the brackets represent the margin of error (95% confidence interval).
Results of the Post-Test
54 people—which is 52% of the pre-test respondents—responded to the leafleting post-test; this left us with an overall completion rate of less than 1%. Due to the low number of post-test responses, our statistician, Dr. Eric Roberts, said that the margins of error were too large to prepare a report on the numbers.
Similarly, the post-test for our Pay Per View survey only resulted in 6 responses, so we were not able to analyze diet change for that survey either.
Pilot Trial Two—Spring 2016
Due to the low response rate to our first LES trial, in the spring of 2016, we experimented by handing out 100 booklets each at two different schools. This time we increased the gift certificate to $10 for 100 of the booklets and to $20 for another 100.
For the $10 and $20 gift certificates, we received 7 and 6 responses, respectively, for the pre-test. For the post-test, we received only 3 and 2 responses respectively.
This response rate, while better than our fall 2015 attempt, was much lower than we had anticipated or desired. We found it especially surprising that the $20 gift certificate group resulted only in 2 post-test completions given the participants received nothing for a complete pre-test but would receive the full $20 for the post-test.
Pilot Trial Three—Fall 2016
We considered using the $10 gift certificate model, but it would require paying for a very large amount of pre-tests that would likely be wasted if we couldn’t get a post-test from a high percentage of the respondents. So, we came up with a new model: Whereas we had been providing payment only at the completion of the post-test, we decided to try immediately paying people $5 for taking the pre-test and then let them know they can receive $10 once they have taken the post-test.
In October 2016, we handed out 100 booklets each at 6 schools. We ended up with 38 responses for a 6.3% pre-test response rate. We then conducted the post-test in late November and early December, receiving 29 responses for a final response rate of 4.8%.
Pay Per Read Study
Earlier in 2016, we released the results of a Pay Per Read study in which people were given a small reward to take a pre-test, then read one of four different booklet PDFs, and then take a post-test a few months later.
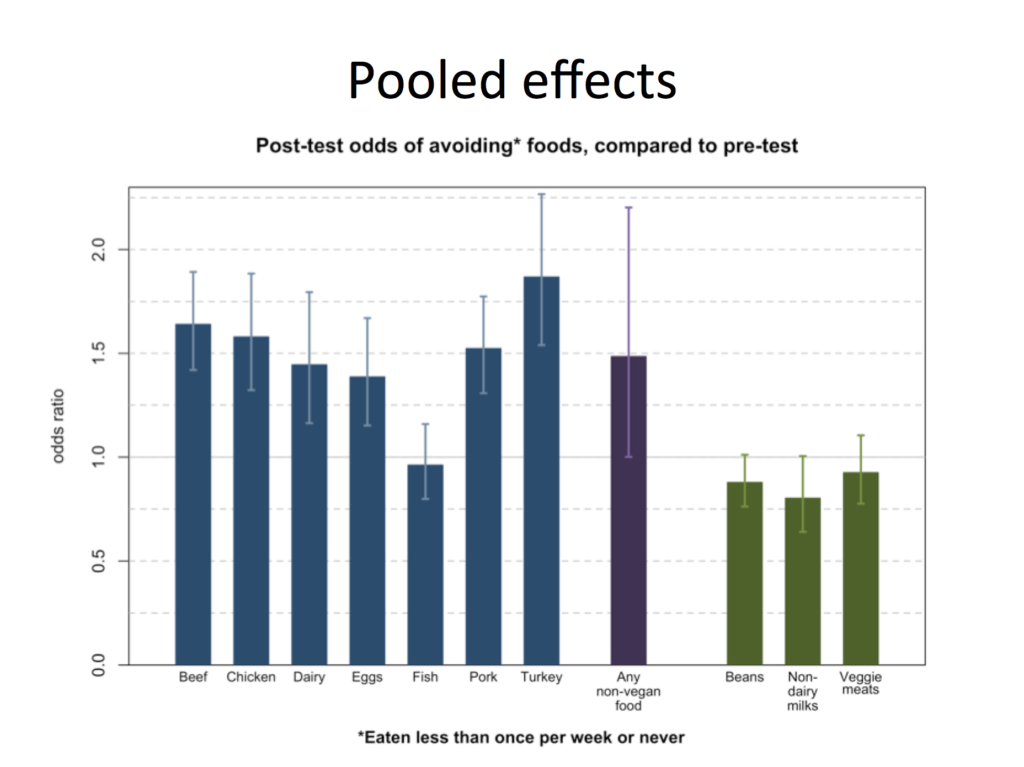
The primary purpose of the study was to compare the effects of different Vegan Outreach booklets. While no difference were found between booklets, an average of one person adopted a mostly vegan diet (reducing their consumption of all non-vegan foods to less than once per week) for every 75 booklets read.
The graph below shows a summary of the food avoidance categories between pre-test and post-test for the animal product categories measured. To briefly explain, a 1.6 odds ratio for the “Beef” category means that someone was 1.6 times more likely to be avoiding any non-vegan food at the time of the post-test than at the time of the pre-test.
Future LES Plans
Our pilot studies for the LES were to determine what minimum incentive for participation is required to obtain enough of a survey response to provide statistically meaningful results with the intent of then recruiting enough study participants in the future.
Our clearest suggestions for the magnitudes of the effects of leafleting might come from our Pay Per Read study mentioned above, so we have been using the odds ratios from that study to estimate the sample sizes we will need for a more comprehensive LES.
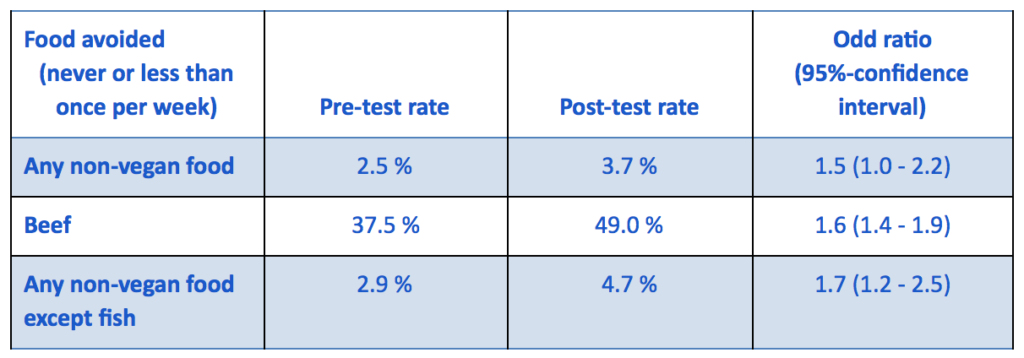
The table below (from the Pay Per Read study) lists the odds ratios for avoidance of some of the animal food categories that we are most interested in measuring in our LES.
Sample size calculations are typically presented as the numbers of subjects required. The table below shows the number of leaflets we predict would be required for an 80% chance of a statistically significant result, known as “80% power calculations.”
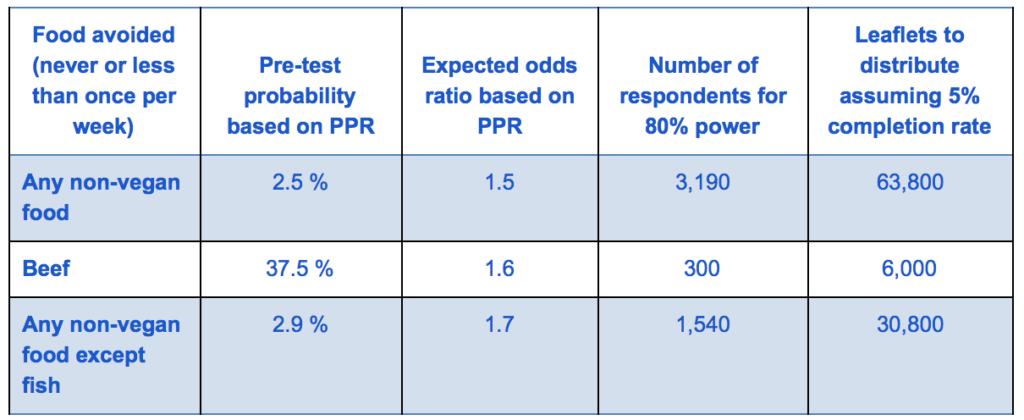
These calculations speak to the required number of subjects in the case group only. The number required for the control group has no mathematical answer since we believe the odds ratio will be close to 1.0 for the control group and are not trying to prove it to be significantly different from 1.0. The number of control subjects we need is subjective, therefore, but we think 500-1,000 would be ample. For 500 control participants, 10,000 booklets would be required.
At $15 per person, the costs for the gift certificates for 1,540 cases plus 500 controls would be $30,600. At a cost of .16 per sticker, 40,800 stickers would cost $6,528. It takes about 3 hours to put stickers on 500 booklets, so it would require approximately 245 hours of stickering booklets. At a cost of .07 per booklet for printing and shipping, the booklets would cost $2,856.
While these numbers are large, they are not out of the realm of possibility and we have also been considering investing in study designs yielding less than 80% power—which would not require such large samples. We also have the option of doing the study in stages and combining the data over time. Finally, we are open to the possibility of partnering with a university group to conduct the study on our behalf.
If Not Leafleting, Then What?
In doing one-on-one outreach to large numbers of individuals, the main method other than leafleting has been showing videos—either with activists showing the videos (as described above in our Pay Per View survey) or via using Facebook ads that lead people to a video.
There has been one study measuring diet change over the course of a few months in people who watched a video (via a Facebook ad). The study was commissioned by Mercy For Animals and conducted with females aged 13-25. It found no decrease in animal product consumption and there was actually a trend towards an increase in animal product consumption.
Despite this finding, neither Mercy for Animals nor Animal Charity Evaluators concluded that Facebook ads increase animal product consumption. I agree that it is unlikely that animal advocacy videos on Facebook—or such videos shown in any context—are likely to increase animal product consumption over the long term.
Vegan Outreach will soon be taking part in Animal Equality’s virtual reality video outreach. Because this experience is much more intense than the typical video of farmed animal treatment, we are hopeful that it will lead to more dietary change.
One goal of our research is to figure out whether we should be spending our time showing videos rather than leafleting whenever possible. Even if it is the case that we should, people should be aware that showing videos to college students has limitations that leafleting does not—particularly access to a wider range of campuses.
Something is Working
At this time, the rate of getting people to change their diets is much slower than we would like. Nonetheless, something is influencing many Americans to go vegan.
A 1994 Roper poll commissioned by The Vegetarian Resource Group (VRG) marked the first year that we began to have fairly reliable surveys of the number of vegetarians and vegans—instead of asking people if they consider themselves vegetarian or vegan, they asked people how often they eat animal products. Referring to their 1994 poll, Charles Stahler of VRG said:
The most surprising aspect of our survey is that up to one half million people in the country may be vegan… Please note that because this is a poll, and we could not ask every person in the country, we are not saying there are 500,000 vegans. We can have some confidence in saying there are between negligible vegans and 700,000 vegans in the country.
A 2016 Harris Poll commissioned by the VRG found that “Approximately 3.7 million U.S. adults are vegan; 4.3 million are vegetarian but not vegan.”
To my knowledge, these polls are the best information we have on how many U.S. adults are vegan, and they show that over 22 years—and a great deal of activism—we have increased the number of vegans by about 3 million.
Just this month (October 2016), PETA released a survey of 1,500 college and university campuses that found the number of schools offering at least one daily vegan option has more than doubled over the last two years to 62 percent—compared to 45 percent in 2015 and 28 percent in 2014 (link).
We can expect that as long as there is not some serious societal catastrophe, the number of vegans should continue to increase; at some point, I hope it will begin to increase exponentially. We believe that our efforts to persuade individuals to change their diets using booklets and videos is contributing—and will continue to contribute—a significant amount to this trend.