By Jack Norris, RD, Vegan Outreach Executive Director and Eric Roberts, MD, PhD
Summary
Vegan Outreach has conducted a large randomized, prospective study examining diet changes three to five months after reading a variety of booklets promoting veganism and awareness of animal suffering. Although few significant differences between booklets were observable in a population of this size (n=1,539), large, measurable decreases in animal consumption were readily seen.
The study also showed that people who newly avoid eating mammals due to reading the booklets are also likely to avoid eating chickens.
In this population, an average of one person reduced their consumption of all non-vegan foods to less than once per week for every 75 Vegan Outreach booklets read.
Introduction
In December of 2014, Vegan Outreach released a report in which we compared the results of attitudes and diet change instigated by reading four different booklets (see Pay Per Read Study Results).
The study was done using a model we call Pay Per Read. We used Amazon Mechanical Turk, a collection of people willing to perform small tasks for small amounts of compensation. In this case, the task was to read one of our booklets and fill out a survey. We then contacted them a month later to see if their diets had changed.
To quickly summarize the results of our 2014 report, readers found Even If You Like Meat more persuasive than Your Choice, although there weren’t enough participants to determine any measurable difference between the booklets in terms of diet change.
At the time, Even If You Like Meat had noticeably more text, citations, and graphic images than Your Choice. It doesn’t focus as much as Your Choice on trying to convince people based on the fact that others are also going veg.
In the time since the 2014 Pay Per Read study was conducted, Even If You Like Meat was updated to have less text and citations were removed. However, it still contains more graphic pictures and spends more time talking about animals and less time talking about how other people are going veg than does Your Choice.
We decided to perform a second Pay Per Read study. This time we wanted to test four different booklets against each other and using more people in an effort to achieve more statistical certainty.
You can download the file, PDF-Slide-Show (PDF), to follow along with a graphic presentation.
Booklets Tested
1. Your Choice • PDF
Your Choice is a booklet that talks about the harm done to animals, but spends a significant amount of space attempting to persuade readers that people such as themselves are going veg, so they should also.
2. Even If You Like Meat • PDF
Even If You Like Meat spends more time trying to persuade people not to eat animal products because of the harm it causes animals and it contains more graphic photos than Your Choice.
3. Speciesism • PDF
Speciesism is the same as Even If You Like Meat but with a different title: “Speciesism: How You Can Help End It,” a page devoted to a discussion of speciesism, and a plea on the inside back cover to combat speciesism: “Combating speciesism means not supporting the violence inflicted on farmed animals!”
This was partly inspired by the words of Peter Singer in his 1975 book Animal Liberation:
It is important to expose and criticize this ideology [of speciesism], because although contemporary attitudes to animals are sufficiently benevolent—on a very selective basis—to allow some improvements in the conditions of animals to be made without challenging basic attitudes to animals, these improvements will always be in danger of erosion unless we alter the underlying position that sanctions the ruthless exploitation of nonhumans for human ends. Only by making a radical break with more than two thousand years of Western thought about animals can we build a solid foundation for the abolition of this exploitation.
While we realize that speciesism is a somewhat complicated concept, we nevertheless wanted to see if it might inspire more of a commitment to change.
4. A Simple Way to Help (referred to here as Chicken Reduction Booklet) • PDF
A Simple Way to Help is a booklet focused on chicken reduction. It’s similar to Even If You Like Meat but with a different title: “A Simple Way to Help: Eating Fewer Chickens Makes the Biggest Difference.” It has only pictures of chickens on the front cover, devotes p. 2 to talking about how eating less chickens helps the most animals, and makes a strong plea to not eat chickens on p. 15.
In the spirit of reducing chicken consumption, all four booklets had this paragraph on p. 15:
Because many more chickens are killed to produce the same amount of meat as from cows and pigs, you’ll prevent more animal suffering by first eliminating chickens.
We summarize our message on p. 15 because it’s the inside back cover and ties each booklet together asking people to take action.
The Slide Show shows the main differences between the booklets.
Study Design
The project utilized a pre-test/post-test design, which is to say that participants were surveyed at the outset (pre-test) to gather information regarding their baseline diets as well as supporting data. Also at this time, the intervention (reading of any of the four booklets) was conducted, with the post-test (a survey with similar structure to the pre-test) being administered three to five months later.
A task opportunity was posted on Amazon Mechanical Turk. When someone decided to take part in the task, they were randomized to one of the four booklets. Once they read the assigned booklet they were asked some questions to determine if they had actually read it and if not, they were removed from participation.
We launched the study on Nov 28, 2015. It took about a week to acquire enough participants and we ended up with the following number of people reading each booklet:
- Chicken Reduction Booklet – 628
- Even If You Like Meat – 634
- Speciesism – 601
- Your Choice – 592
For this study, we decided not to use a control group that didn’t read a booklet. We went this route because every wing of the study is costly, eats into the pool of potential participants, and we were more interested in the differences between booklets.
At the end of the pre-test survey, we asked people if they’d like us to email them a link to the PDF of the booklet. We gave people this option because one of the funders of the study was interested in seeing if people would check out the links for more information about how to eat healthy as a vegetarian or vegan. 235 people took us up on the offer (with no differences between booklet groups).
Three months later we asked the participants to take the post-test survey. The post-test phase took two months (after an initial burst of responses, people slowly responded to the survey) and we ended up with the following number of people completing the post-test:
- Chicken Reduction Booklet – 404
- Even If You Like Meat – 386
- Speciesism – 393
- Your Choice – 356
For both pre-test and post-test surveys, we inquired about the respondent’s consumption of the following animal foods:
- Beef
- Chicken
- Dairy
- Eggs
- Fish
- Pork
- Turkey
We also asked about these plant-based foods:
- Beans
- Non-dairy milks
- Veggie meats
We asked each person how often in the previous 3 months (for pre-test) or 1 month (for post-test) they ate the above foods using the following scale:
- Never
- Less than 1 time per week
- 1-6 times per week
- 1-3 times per day
- 4 or more times per day
Definition of Outcome
For the following analyses, we were mostly interested in the avoidance of non-vegan foods; we were concerned that confining ourselves to the “Never” category for an outcome would restrict our numbers to being unnecessarily small and magnify ambiguity due to multiple ways respondents might be interpreting this option.
We therefore use as our outcome what we call “single-week avoidance” of foods, which is a collapsing of the categories “Never” and “Less than 1 time per week.” A “single-week vegan” is therefore someone reporting either of these categories for every non-vegan food, and similar outcomes can be determined for the avoidance of land animals, mammals, etc. As examples, at the time of the pre-test, the prevalence of single-week avoidance of beef was 37.5% among our subjects, that for birds was 17.0%, and that for all non-vegan foods was 2.8%.
Analysis
Since we’re interested in the effects of the booklets, we consider the prevalence of food avoidance at post-test relative to that at pre-test. Researchers commonly express such effects as odds ratios, which are the odds of avoiding foods at post-test divided by those at pre-test. If reading the booklets has a beneficial effect, we expect the odds ratio for non-vegan foods to be greater than 1.0. Similarly, we may expect the odds ratios for various vegan foods to be less than 1.0, although this was not the main focus of our survey.
When comparing booklets, odds ratios and their 95%-confidence intervals were calculated using standard logistic regression. When pooling the effects across all booklets, we employed random effects logistic models to account for the fact that our interventions were not strictly similar. Finally, to assess patterns of responses to health questions (the cross-tabulations discussed below), we conducted chi-squared analyses.
Results
Vegan Outreach used the same food frequency survey for this Pay Per Read as we use for Pay Per View events on college campuses (where students are offered $1-3 to watch a video on farmed animal treatment).
We found that the dietary patterns of our Pay Per Read participants were similar to those watching videos on college campuses. In other words, both groups of people have similar eating habits and thus probably reflect a fairly standard diet for the typical target audience of our booklets (college students).
Impact and Differences of Individual Booklets
Readers of all four booklets showed a significant increase in the avoidance of beef, chicken, dairy, turkey, and pork (with most results being clearly statistically significant). For eggs, all booklets but Your Choice showed an increase in avoiders that were statistically significant. The number of fish avoiders remained unchanged.
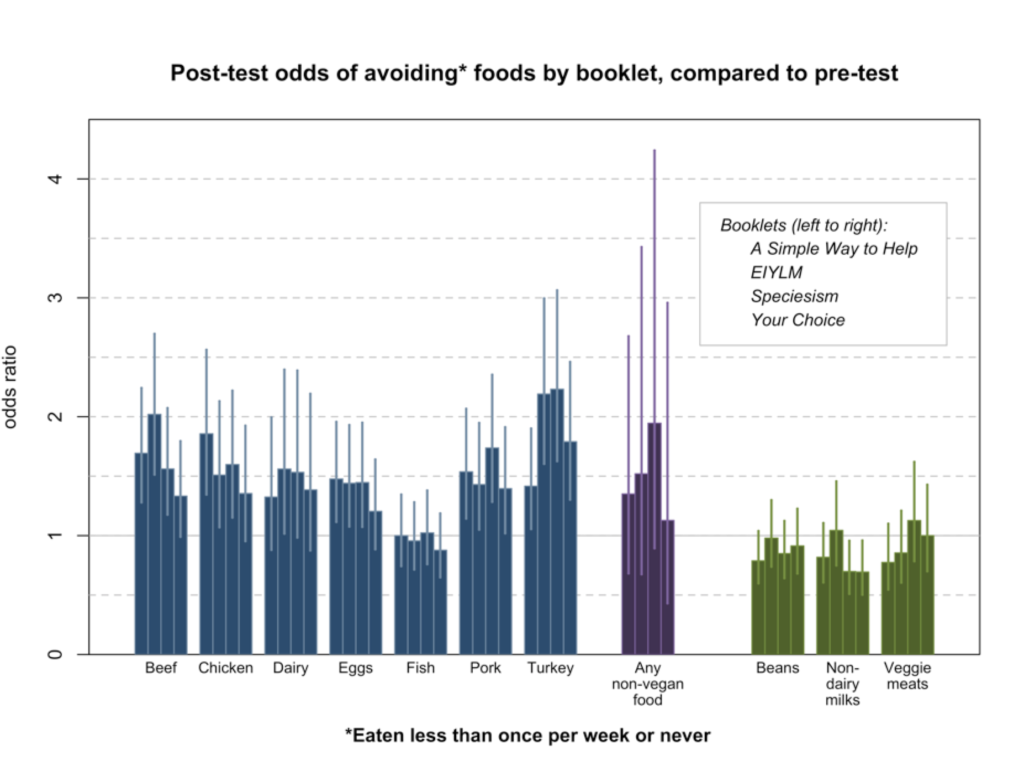
The most interesting question between booklets was whether the Chicken Reduction Booklet would lead to more chicken avoiders. The trend was that the Chicken Reduction Booklet did lead to more chicken avoiders, but there was a large overlap in the margin of error (i.e., the 95% confidence interval) with the other booklets.
We combined the results into mammals (beef and pork), birds (chicken and turkey), land animals (mammals and birds), meat (mammals, birds, and fish), land animal products (mammals, birds, eggs, dairy), and all animal products (land animal products plus fish). There were no statistically significant differences between booklets, although there was a trend for Speciesism to reduce land animal products and all animal products more than the other booklets.
Given the overall effectiveness of each booklet, our study was insufficiently powered to detect differences between them. By our calculations, each booklet group would need post-test samples of 500-700 respondents to give us a 60% chance of observing a 20% difference between booklets.
Results of All Booklets Combined
When combining the four booklet groups into a single random effects model, there was a strong, statistically significant increase in beef, chicken, dairy, eggs, pork, and turkey avoiders.
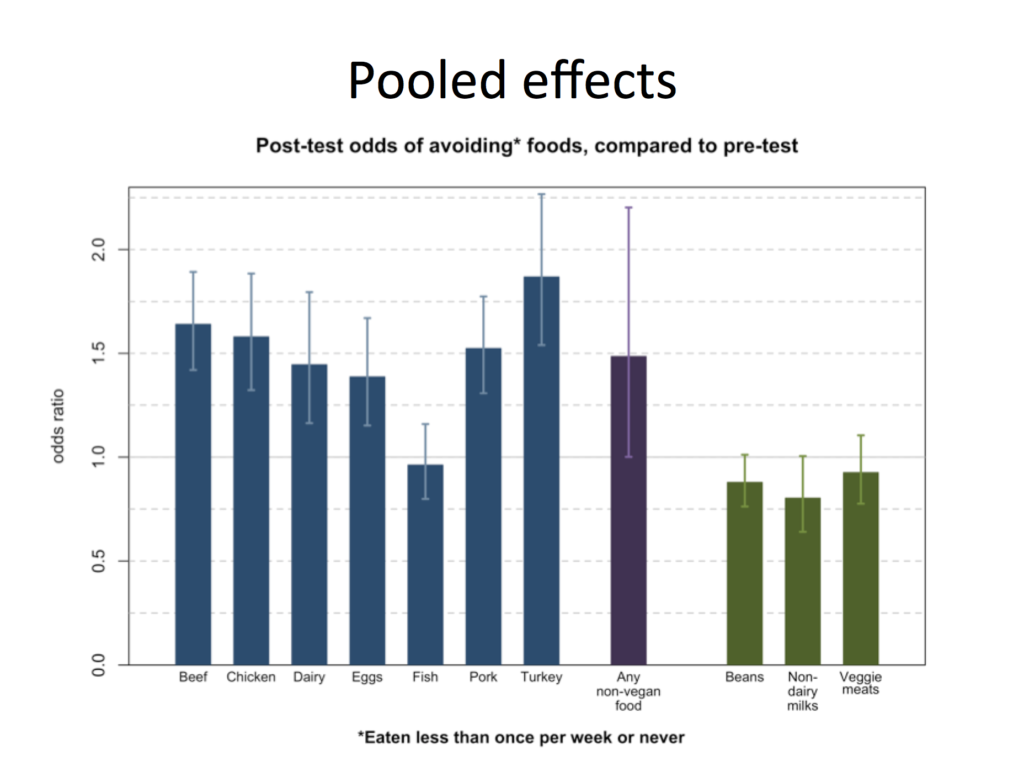
Note: Because Thanksgiving had been just prior to the first survey, it’s likely that the very large increase in turkey avoiders can partially be explained by the fact that people were more likely than usual to have recently eaten turkey at pre-test.
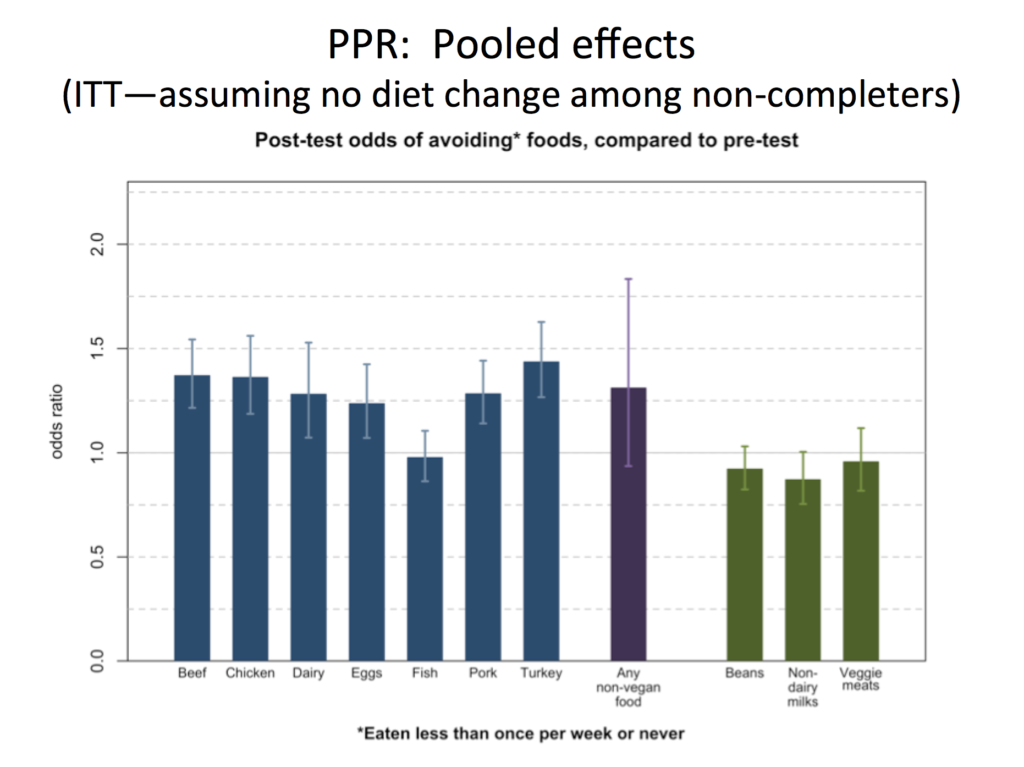
All of the preceding analysis only included people who completed both pre-test and post-test. We noted, however, that 37.3% of our pre-test respondents failed to complete the post-test within five months. We decided to address this by conducting an “intent to treat” analysis that includes all pre-test respondents and assumes that the diets of non-post-test respondents remained unchanged. This produced attenuated versions of the effects described above, but nearly all of the previously significant effects remained so with the intent-to-treat analysis. This suggests that—barring pronounced bias among non-completers—our results are robust even in light of this partial response.
Diet Substitution
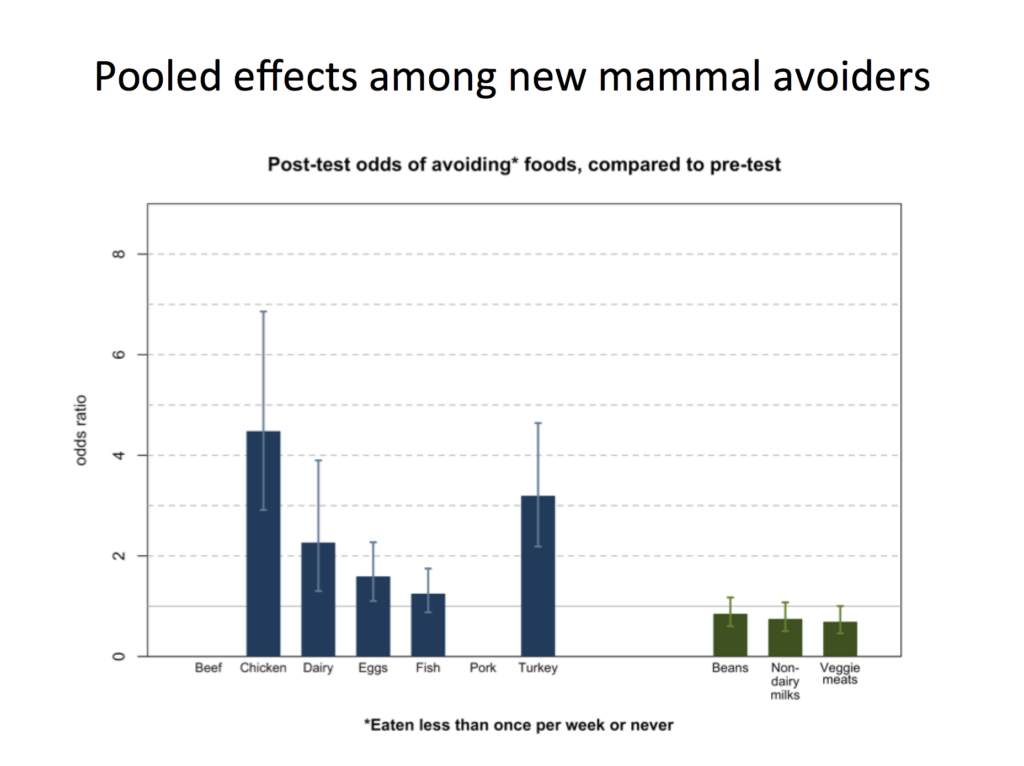
There is a concern among the farmed animal advocacy community that our efforts to get people to change their diets could lead to an increase in animals being factory farmed because people might replace the mammals in their diet with birds and many more birds must be killed to provide the same amount of meat.
We addressed this question by confining our analysis to respondents that newly began avoiding foods (such as beef or chicken) after the pre-test. If substitution were occurring, we would expect to see the effects reverse (odds ratios less than 1.0) for non-vegan foods among this group.
We found the opposite to be true, however—people newly avoiding beef or pork were also more likely to start avoiding chicken, and vice-versa. People who started avoiding dairy were also likely to start avoiding beef, pork, chicken, and eggs.
Effects Among Demographic Subsets
There were 1,004 women and 535 men who completed the post-test survey. No statistically significant differences in booklet effect were found between the two genders.
To see what differences there were between age groups in terms of diet change, we divided the group into:
- 18-24 years • 182 people
- 25-34 years • 562 people
- 35-44 years • 371 people
- 44+ years • 424 people
There were no statistically significant differences in booklet effect between age groups.
We stratified by education level:
- High School diploma or less • 169 people
- Some college • 609
- Bachelor’s degree or more • 761
There were no statistically significant differences in booklet effect between education levels.
Number Needed To Treat
We calculated the number of booklet readers needed to create a single-week vegan and determined the number to be 75 booklets for this population.
Health Question Results
In the follow-up survey, we asked participants questions about how healthy they felt and what veg health information they looked up.
There were a number of statistically significant associations (based on chi-squared analysis):
| People with these diet characteristics at post-test… | Were more likely to… |
| Avoid eating any type of meat | …have requested the booklet PDF |
| Avoid eating beef or chicken | …feel more healthy rather than less healthy |
| Not avoid beans | …have requested the booklet PDF, and |
| …feel more healthy rather than less healthy |
These findings give us reason to believe that providing the nutrition information in our booklets is helpful for an important segment of people, as is promoting legumes.
For more information on this subset of correlations, please see Health Correlations (Excel file).
Conclusion
This study can’t determine how many booklets are required–when leafleting–to create one single-week vegan (or anything similar), because there is no guarantee that someone who is handed a booklet will read it. However, among people on college campuses who are handed a booklet and read it, these results possibly give us the best glimpses into the impact of booklets to date.
In summary:
- According to these data, every 75 booklets read could result in one person reducing their consumption of all non-vegan foods to less than once per week.
- The differences in effects between the typical booklets used by Vegan Outreach and similar messages examined here are not large enough that they can be measured with samples of this size.
- People who read a booklet and begin avoiding beef and pork are likely to also begin avoiding chicken and other animal products.
- Including information on healthy eating and promoting legumes in booklets is likely helpful.
We would like to give a special thank you to Cobie deLespinasse and Eric Gastfriend for their valuable help with this study.