By Jack Norris, Executive Director, and Rania Hannan, Research and Assessment Specialist
Introduction
People have always asked us at Vegan Outreach how we know whether leafleting makes a difference. We’ve mainly had anecdotal evidence to provide them, that we regularly highlight in our bi-monthly newsletter (and for years compiled on our website).
The impact that can be palpably felt on college campuses when leafleting—by talking to interested students, seeing people reading the booklets, and overhearing people discuss the issue—typically leaves an activist with a strong sense that they’re making an impact. These feelings are what keep so many leafleters going out day after day.
Still, it would be great to have more precise information about the impact of leafleting. In so doing, we should keep in mind that there are multiple scenarios where leafleting is likely to make a positive difference.
- Direct Diet Change: A person receiving a booklet is moved emotionally or intellectually by the suffering of farmed animals which inspires current or future diet change.
- Education: Leafleting educates a generation of college students about the concept of veganism and speciesism, creating a new conversation around the ethics of killing animals for food.
- Word of Mouth: The original booklet recipient shares that information with others either through conversation or passing along the booklet.
- Touchpoint: A person is made aware of the suffering of farmed animals by a booklet, which makes them more likely to change their diet when presented with a future outreach activity.
- Animal Protection Community-Building: Leafleting is a low barrier-to-entry activity for new animal activists. Taking part in leafleting outings builds important connections between people and organizations in the animal protection community.
Historically, studies on leafleting have focused on direct diet change. And our leafleting effectiveness study (LES) is also focused on direct diet change, but to get a full assessment of the benefits of leafleting, these other dimensions should be taken into consideration.
Previous Studies on Reading Booklets
Vegan Outreach has conducted two online booklet reading studies, also known as Pay Per Read.
2014 Pay Per Read Study
In 2014, we conducted our first Pay Per Read study using Amazon Mechanical Turk. Participants read Your Choice, Even if You Like Meat, or a control booklet about immigration and then completed a survey about their intention to change their diet. 223 people read Your Choice, 181 read Even if You Like Meat, and 213 read the control pamphlet. One month later, 67 of the Your Choice, 134 of the Even if You Like Meat, and 158 of the control booklet readers completed a follow-up survey to measure diet change.
Readers found Even If You Like Meat more persuasive than Your Choice, although there weren’t enough participants to determine any measurable difference between the booklets in terms of diet change. At the time, Even If You Like Meat had noticeably more text, citations, and graphic images than Your Choice, and less of a focus on trying to persuade people based on the fact that others are also going veg.
The results suggested that 1 out of every 60-100 readers may have become pescatarian, vegetarian, or vegan due to reading the booklet. These results are highly uncertain due to a lack of statistical significance.
2016 Pay Per Read Study
In 2016, we conducted another online Pay Per Read study to compare the effects of different Vegan Outreach booklets. Through Amazon Mechanical Turk, 2,455 participants completed a pre-test, which included questions about their baseline diet, and then read one of four booklets:
- Your Choice: Emphasizes harm done to animals and attempts to persuade readers to go veg by saying that people like themselves are going veg, so they should too.
- Even if You Like Meat: Spends more time trying to persuade people not to eat animal products because of the harm it causes animals and contains more graphic photos than Your Choice.
- Speciesism: How You Can Help End It: The same content as Even If You Like Meat, with a page devoted to a discussion of speciesism, and a plea to combat speciesism.
- A Simple Way to Help: Similar to Even If You Like Meat but focuses on chicken reduction. It has only pictures of chickens on the front cover, devotes a page to talking about how eating less chickens helps the most animals, and makes a strong plea to not eat chickens.
Three to five months later, 1,539 participants completed the post-test survey. We found:
- Readers of all four booklets showed a significant increase in the avoidance of beef, chicken, dairy, turkey, and pork (with most results being statistically significant when compared to the pre-test).
- There were no statistically significant differences between booklets, although there was a trend for Speciesism to reduce animal product consumption more than the other booklets.
- An average of one person adopted a mostly vegan diet (reducing their consumption of all non-vegan foods to less than once per week) for every 75 booklets read.
- People who newly avoided eating mammals due to reading the booklets were also likely to avoid eating chickens.
Previous Studies on Leafleting
There’ve been two studies attempting to measure the impact of leafleting on diet change, both released in 2013. One study was performed by Farm Sanctuary and The Humane League (link) and the other was performed by Animal Charity Evaluators (link).
Both studies found support that leafleting leads to diet change, but they didn’t have many statistically significant findings. They also didn’t use a pre-test/post-test model in which diet change was measured before and after treatment.
There’s been one additional study (released in 2015) that was similar to leafleting on college campuses. The Humane League went to colleges and asked students to take a food frequency survey after which they were given a booklet. The students were contacted a few months later and given a follow-up food frequency survey. The intent of the study was to see how four different messages, and no message at all for a control group, impacted dietary change. The study had between 126 and 149 students in each treatment group and 57 in the control. Surprisingly, they found that the control group reduced their animal product consumption more than the treatment groups. But, in any case, this study tested responses to booklets among people who stopped to take the survey and might not apply to leafleting (PDF).
Vegan Outreach’s Pilot Studies
Pilot Trial One—Fall 2015
We handed out 5,000 copies of our Your Choice booklet (500 per school at 10 schools) and 1,000 control brochures at one school. Participants received a $5 gift certificate for completing the pre- and post-test. The pre-test response rate was 1.8% for the treatment group (88 respondents) and 1.6% for the control group (16 respondents). 54 respondents—52% of the pre-test respondents—completed the post-test. The overall completion rate was less than 1%.
Pilot Trial Two—Spring 2016
We handed out 100 booklets at two schools. In this round, we increased the gift certificate amount—upon completion of both surveys—to $10 for 100 booklets and $20 for the other 100. The response rates were still lower than we had desired. For the pre-test, we received 7 responses for the $10 gift certificate and 6 for the $20 gift certificate. For the post-test, we received 3 responses for the $10 gift certificate and 2 for the $20.
Pilot Trial Three—Fall 2016
We distributed 100 booklets each at 6 schools. Participants received $5 for completing the pre-test and $10 for completing the post-test. The response rates were higher this round, with 6.3% (38 respondents) for the pre-test and 4.8% (29 respondents) for the post-test.
Spring 2018 Leafleting Effectiveness Study
Overview
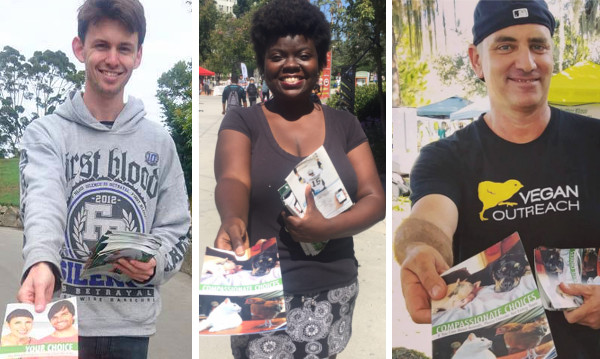
In the spring of 2018, our outreach coordinators handed out two different treatment booklets, along with control cards at different college campuses.
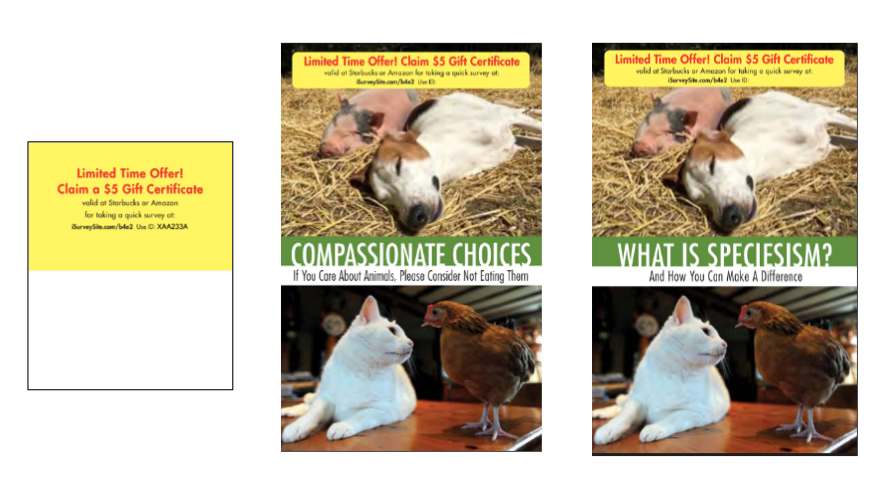
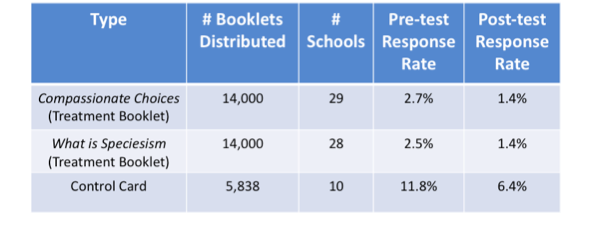
We handed out 14,000 Compassionate Choices at 29 schools and 14,000 What Is Speciesism booklets at 28 schools, along with 5,838 control cards at 10 other schools.
Unlike the LES pilot tests, stickers were printed on the front covers, rather than physically stuck on the front, which might have reduced the students noticing them.
Participants took a pre-test that measured their animal product intake, followed by a post-test given to them approximately one month later. Participants received $5 for completing the pre-test and $10 for completing the post-test.
Response Rate
Compassionate Choices had a pre-test response rate of 2.7% and post-test response rate of 1.4%, while What is Speciesism had a pre-test response rate of 2.5% and post-test response rate of 1.4%. The control cards had a higher response rate of 11.8% for the pre-test and 6.4% for the post-test.
Higher tuition schools had very low response rates—perhaps $5 for the pre-test wasn’t much of an incentive. We hadn’t included a higher tuition school in our pilot studies and didn’t anticipate this problem.
Diet Changes
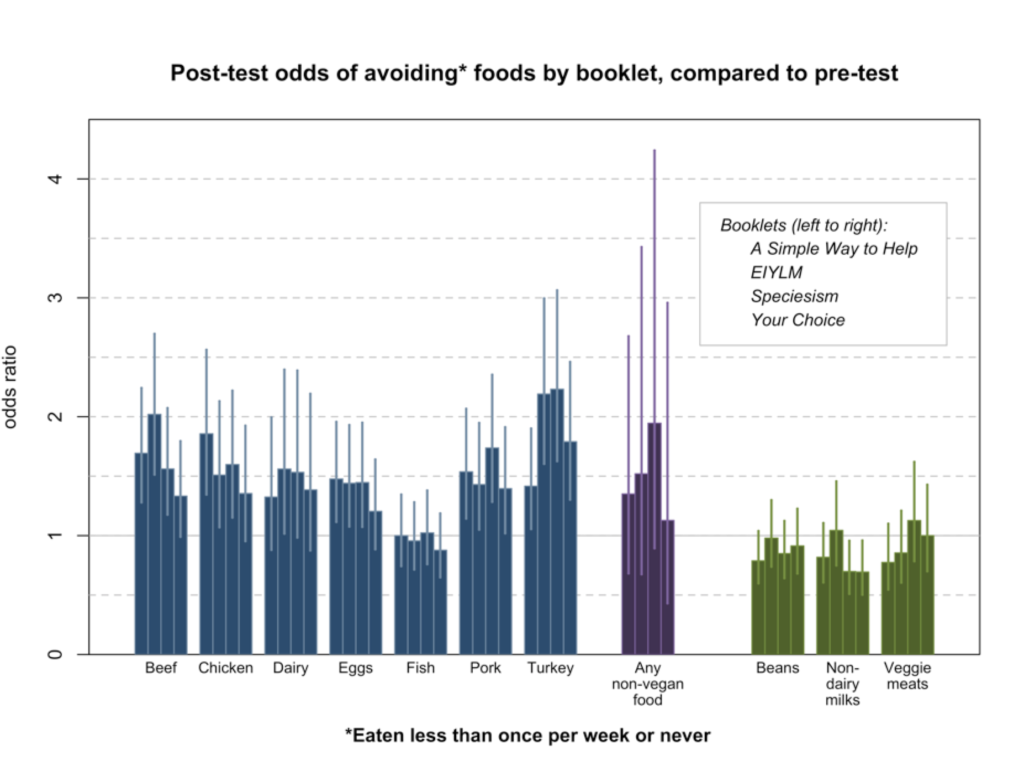
Results tended to go in the directions we expect, but with wide confidence intervals. Results from the post-test show that those who read either booklet reduced their consumption of beef, chicken, dairy, eggs, fish, and pork. What is Speciesism made a larger impact than Compassionate Choices in reported animal product consumption reduction in all categories except for fish.
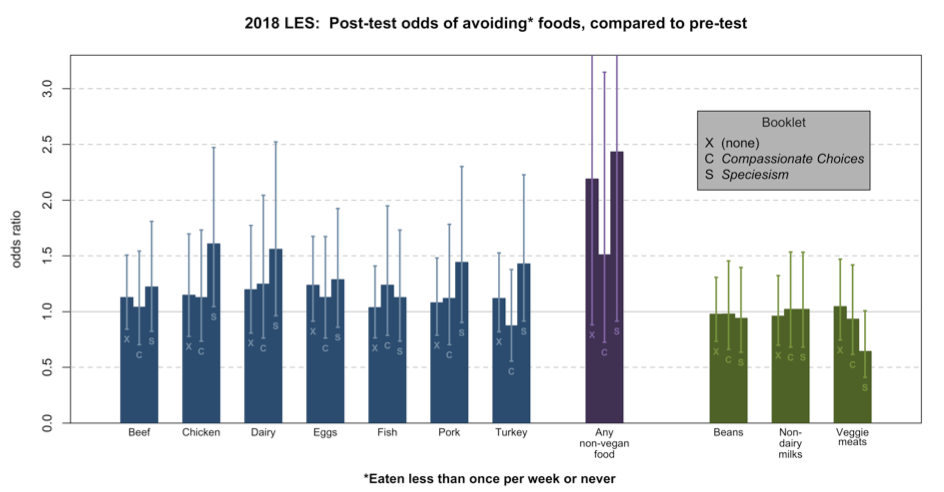
While both booklet groups showed a trend toward reducing animal product consumption, the control group also showed such a trend. This could be due to survey-taker bias, a random anomaly, or because taking a survey about animal product consumption leads to reduced intake over the next month.
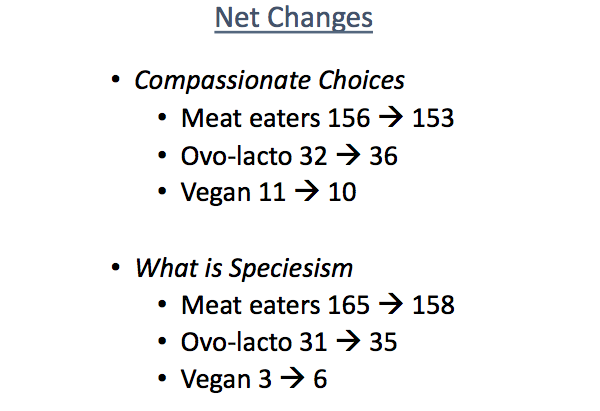
In terms of how people identify themselves, the What is Speciesism group had 7 additional people identifying as ovo-lacto vegetarian or vegan while the Compassionate Choices group had 3 (see image below).
Creating a New Single Week Vegan
As in our earlier online booklet study, the main outcome we were measuring was how many people became single week vegans, defined as someone who answered “less than one time per week” or “never” for the eating frequency of every animal product.
Out of the 400 surveys completed by those who received a treatment booklet, there were 18 new single week vegans, but 4 people who stopped being a single week vegan, for a net of 14 new single week vegans. Out of the 372 surveys completed by the control group, there were 8 net new single week vegans.
We calculate that 74 booklets need to be read to create a net new single week vegan:
Rate of change for treatment: (18-4)/400 = .035
Rate of change for control: 8/372 = .021
Net rate of change per booklet: .035 – .021 = .0135
Inverse: 74.1
Our finding that it required 74 booklets to be read to produce a single week vegan matches the 75 booklet result we received from our online booklet study, as mentioned above.
But this doesn’t answer how effective leafleting is because we don’t know how many booklets are read.
Our spring 2018 LES does provide insight into this as 59 people who received treatment booklets started the pre-test and answered that they hadn’t read the booklet. We decided to end the study for such people (rather than to pay them the gift certificates). In retrospect, it might have been better to put them through the pre- and post-tests as a second set of controls. But, in any case, if you add these 59 people to our booklets per single-week vegan calculations, we get:
Rate of change for treatment: (18-4)/459 = .0305
Rate of change for control: 8/372 = .0215
Net rate of change per booklet: .0305 – .021 = .0085
Inverse: 118
It might seem as though 13% (59 out of 459) is a very low estimate for how many people don’t read the booklets. However, when we leaflet colleges and later check trash cans in the vicinity, they don’t typically have an enormous amount of booklets—though it does depend on how fast we’re handing them out.
What is meant by “reading the booklet” is open to some interpretation—most people probably page through it before discarding and that could be enough to make them think more about the issue. If we consider paging through the booklet and reading at least some of it to be “reading” the booklet, then a 13% non-read rate might be in the realm of possibility.
LES Combined Results
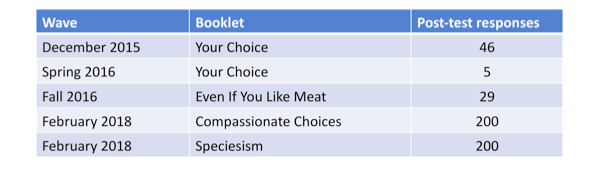
We combined the Spring 2018 LES results with our pilot study data. We used a random effects model that considers each wave-booklet combination as if it were its own study.
The graph below shows the weighted average of all the random effects. When we combine our most recent data with that of previous waves, we find that reading a booklet makes an impact on the odds of avoiding animal products. Compared to the control group, those who read a VO booklet reported they were less likely to eat chicken, dairy, fish, pork, and turkey—though the findings were not statistically significant.
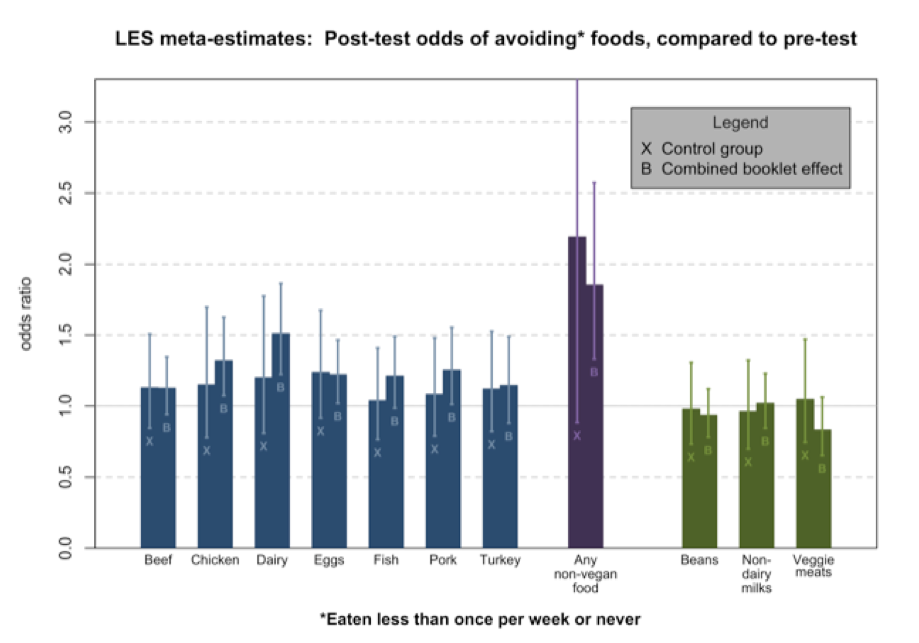 Click to enlarge image
Future of Measurements
We have a handful of concerns about continuing to run the LES.
The LES is expensive (this round cost $20,376), has a very low survey response rate which makes extrapolation difficult, has a potentially large survey-taker bias, and a low post-test completion rate.
We also experienced about 10% of responses being from people attempting to game the system—their answers were removed from our analyses above—which would likely increase with larger gift certificate amounts, should we attempt larger amounts to increase the response rate.
We ran power calculations for what another similar-costing round of the LES would likely bring us and while the confidence intervals would shrink, it wouldn’t be enough to reach statistical significance between the treatment group and controls.
For these reasons, we developed an alternative plan for assessing the benefits of leafleting.
Currently, the back cover of our booklets lists a link for a Guide to Animal-Free Eating, which directs people to the sign-up form for our 10 Weeks to Vegan (10W) email series. New booklets will have a much larger plea for the 10 Weeks to Vegan sign-up (as shown in the image below).
 Click to enlarge image
Although it will take some time for these booklets to arrive in circulation, once they do, we’ll get an idea of the minimum impact we’re having by tracking 10 Weeks to Vegan signups from our booklets.
If Not Leafleting, Then What?
For doing outreach to large numbers of individuals, the main method other than leafleting has been showing videos—either with activists showing the videos or via using Facebook ads that lead people to a video.
Faunalytics and Animal Equality did a study on video outreach in which they found that people who watched a video of factory farm pig suffering had stronger anti-pork attitudes immediately and one month after viewing. Compared to the control group, those who watched either video reported eating slightly less pork one month later.
Another study by Mercy for Animals measured diet change over the course of a few months in females aged 13-25 who watched a video (via a Facebook ad). They found no decrease in animal product consumption.
Although it isn’t yet clear whether leafleting or video outreach is more cost-effective, Vegan Outreach has been doing more virtual reality video outreach to balance out our leafleting. Our original goal was to show virtual reality videos to 10,000 people in 2018, but thanks to the dedication and enthusiasm of our outreach staff, we easily blew through that goal by mid-year!
The Number of Vegans is Growing
A 1994 Roper Poll commissioned by The Vegetarian Resource Group (VRG) marked the first year where surveys estimating the number of vegetarians and vegans asked people what animal products they eat rather than whether they consider themselves vegetarian or vegan.
Referring to their 1994 poll, Charles Stahler of VRG said, “We can have some confidence in saying there are between negligible vegans and 700,000 vegans in the country.” Since then, VRG commissioned a number of polls and their latest poll in 2019 found that approximately 2% of US adults are vegan. Applying their results to the US adult population shows that 5.1 million American adults are considered vegan.
Gallup conducted a poll in 2018 and found that the percentage of U.S. adult vegetarians has remained at 5% since their previous poll in 2012. However, they found that 3% of U.S. adults now consider themselves to be vegan compared to 2% in 2012—this is a 50% increase. Applying their results to the US adult population shows that 7.6 million American adults consider themselves to be vegan.
These polls are the best information we have on how many U.S. adults are vegan, and they show that over 22 years—and a great deal of activism—we have increased the number of vegans by many millions.
Outreach should fuel a continued increase in the number of vegans and, at some point, we should reach a tipping point where the number increases exponentially.